SMCI 6-day bearish forecast — Nov 1, 2026
- Bias: Bearish
- Timeframe: 6 days (made Nov 1, 2026, target date Nov 6, 2026)
- Price at analysis: $32.95
- Price target: $32.30
- Expected range: $31.20 – $33.60
- Result: Correct (-12.5%) — closed at $28.84 on Nov 6, 2026; quality score 50/100
Get a free AI analysis of SMCI today
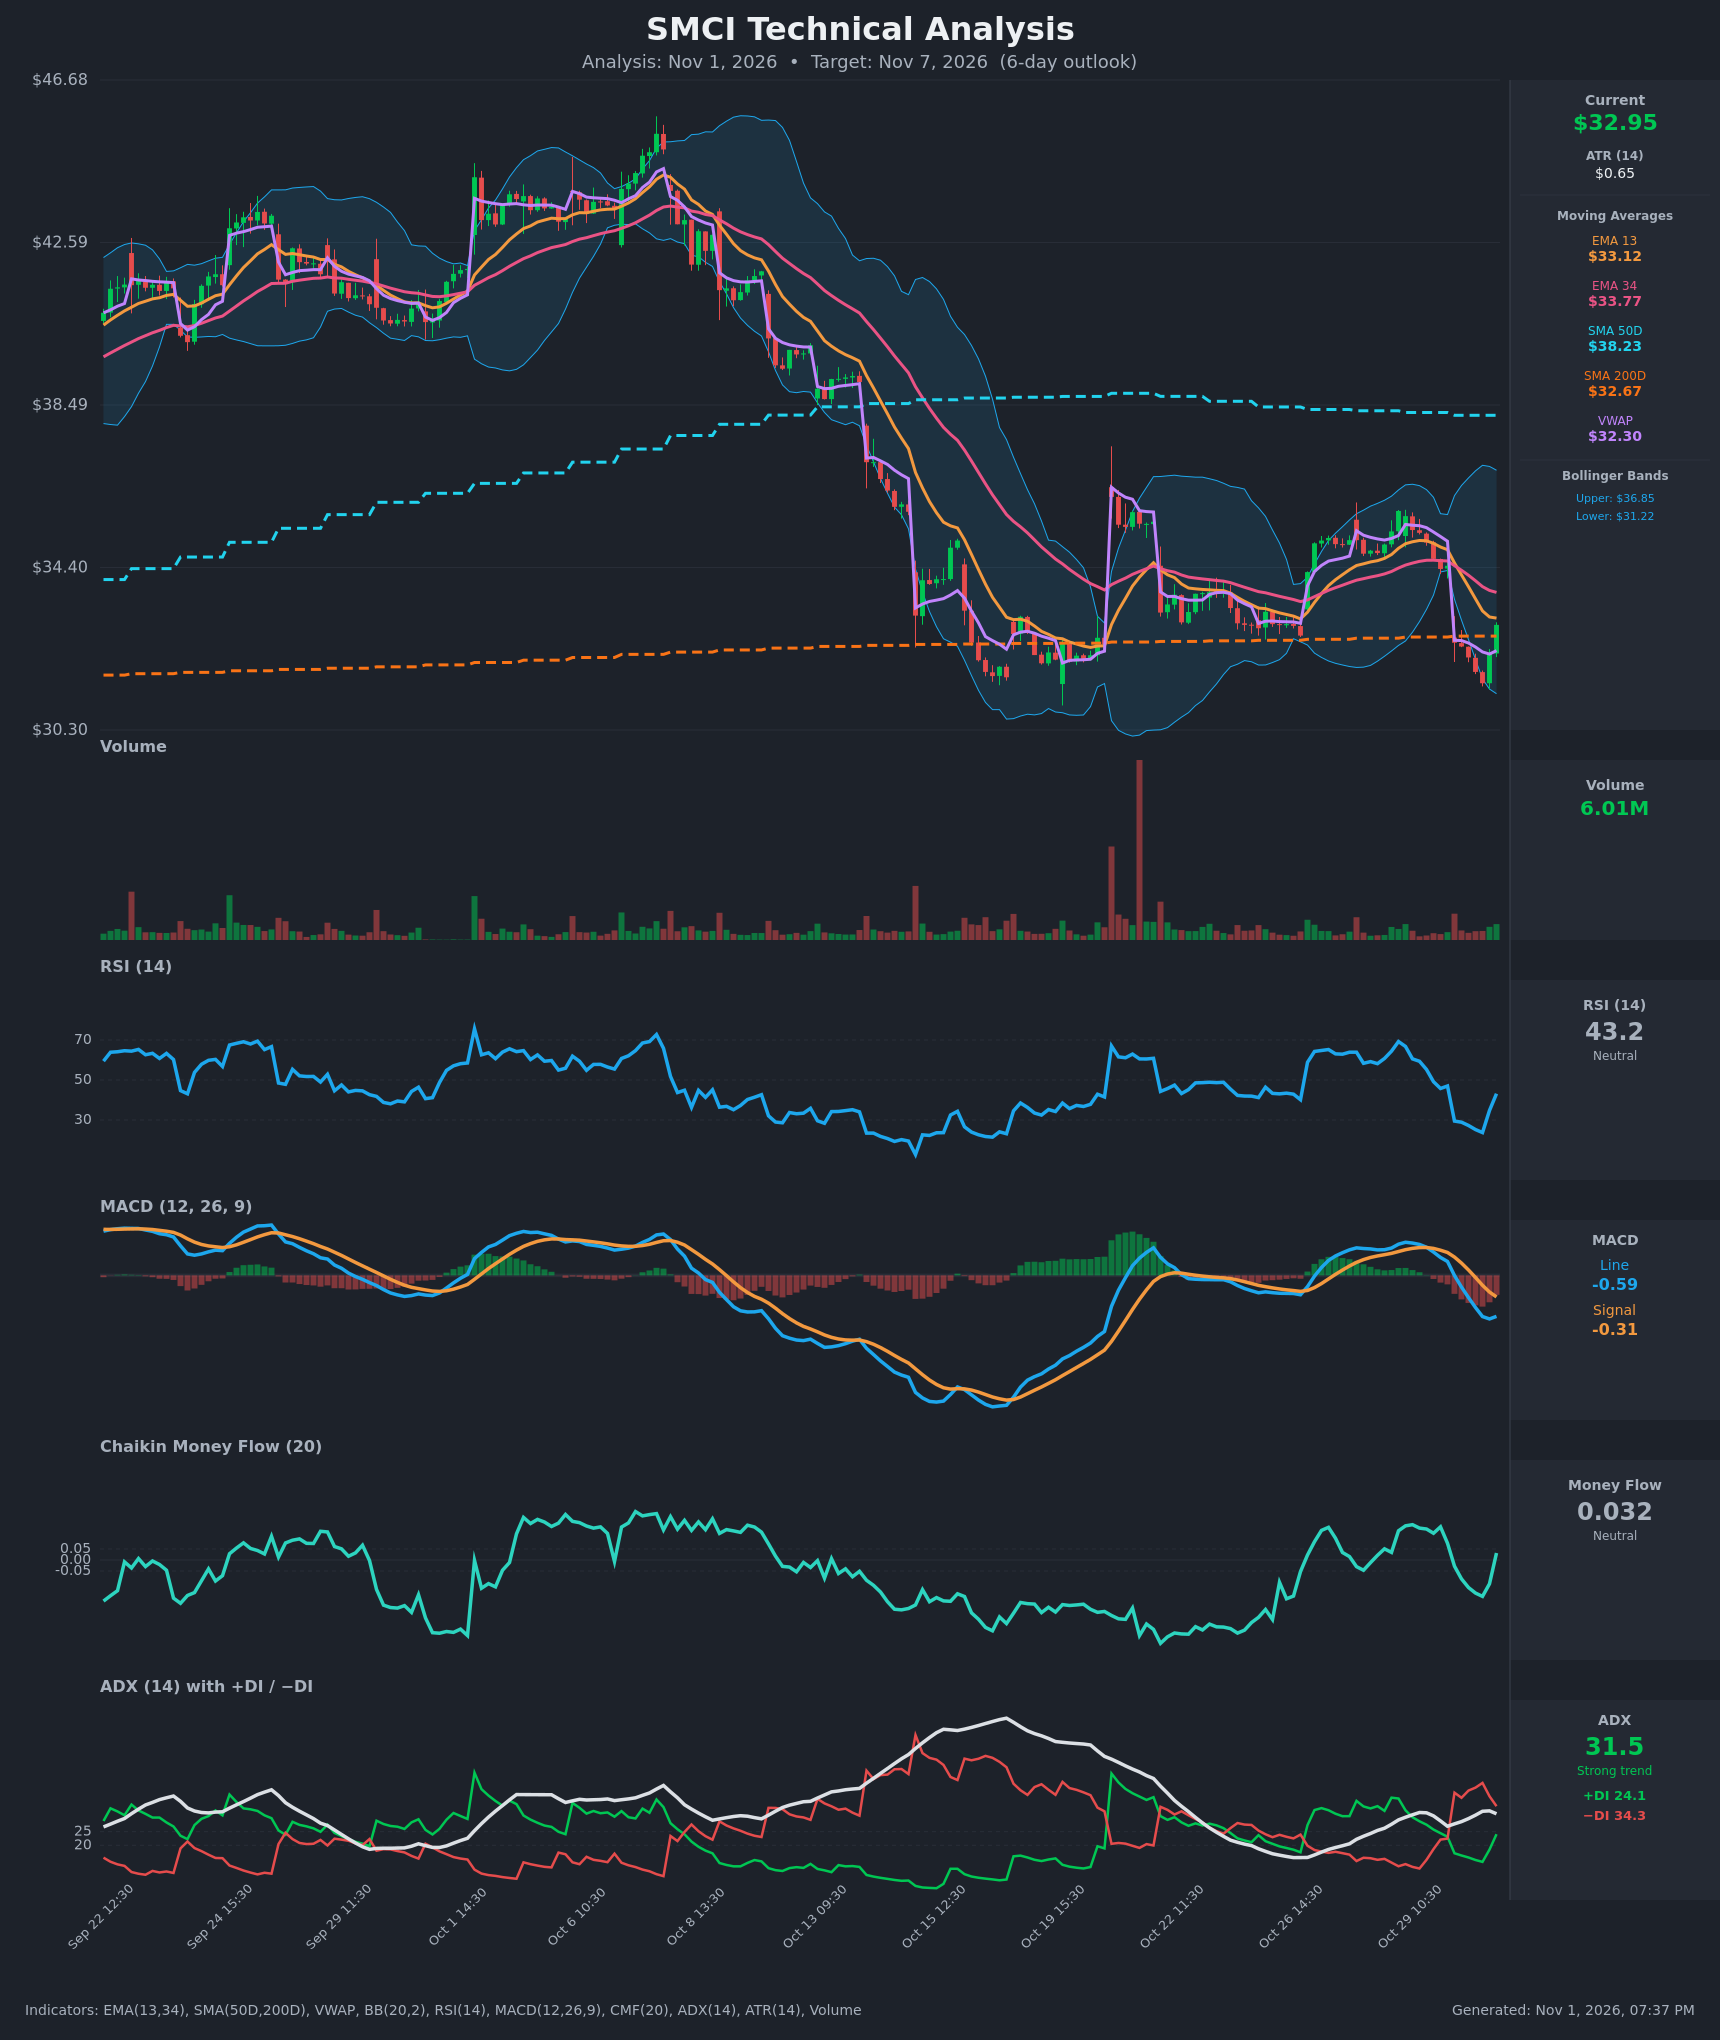
Analysis
TECHNICAL INDICATORS
- RSI (14): 43.15, rebounding sharply from a deeply oversold 23.7 on Oct 30 13:30. Momentum is turning up, but the reading is still below 50 and below the 55-60 zone where the last rally stalled. [Neutral]
- 20 EMA: The chart shows EMA 13 at $33.12 and EMA 34 at $33.77 (no 20 EMA is plotted). Price at $32.95 is below both, so they act as overhead resistance. EMA13 is below EMA34 after a bearish cross on Oct 30 and both are sloping down. [Bearish]
- MACD: Line -0.59 is below Signal -0.31 after a bearish cross on Oct 30 12:30. The histogram is about -0.28 but has stopped widening, as the line ticked up from -0.626. This is early momentum stabilization, not a bullish cross. [Bearish]
- Bollinger Bands (20): Upper $36.85, lower $31.22, midline about $34.03. Price tagged the lower band (low $31.48) and bounced to the lower half of the bands. The bands are wide after the gap-down, so volatility is elevated. Price is below the midline, which favors sellers unless it reclaims about $34. [Neutral]
- CMF (20): 0.032, up from -0.166 and now between ±0.05. Selling pressure has faded, but there is no accumulation confirmation yet. [Neutral]
- ADX (14): 31.5 (down from 32.6), with −DI 34.3 above +DI 24.1. This is a strong trend with bears in control. The gap between the DIs is narrowing (−DI was 42.8, +DI 13.9), which points to a relief bounce rather than a reversal. [Strong Trend – Bearish]
- Volume: 6.01M on the latest green rebound bar, above the quiet bars before it. The bounce has some participation, but it is nowhere near the capitulation spikes seen earlier in the move. [Mildly supportive of a bounce, not a reversal]
Other context from the data:
- Price is above SMA200 ($32.67) by only $0.28 and above VWAP ($32.30), which is the only supportive structure.
- Price is far below SMA50 ($38.23), and SMA50 is above SMA200 but flattening and rolling over.
DIVERGENCES & TRENDS
- Divergence: There is no clear bullish divergence yet. RSI made a lower low (23.7) with price at $31.48, but the low is only one swing deep.
- Trend: The intraday trend is down. Price has lower highs ($35.82 → $34.44) and a gap-down on Oct 30 from $34.44 to $32.50, which remains unfilled.
- Crossovers: EMA13 crossed below EMA34 and MACD crossed below its signal line on Oct 30. Price is also below the declining SMA50.
- Indicator momentum: RSI and CMF are recovering, and +DI is rising while −DI falls. This is a counter-trend bounce that is testing EMA13 resistance at $33.12.
- Support test: Price is hovering around SMA200 ($32.67), which has been a pivot repeatedly. A loss of it on a closing basis would reopen $31.50.
CHART PATTERNS
- Bearish Flag / Rising Channel (breakdown): The Oct 22–29 grind higher from about $33 to $35.8 inside a rising channel resembles the Bearish Flag/Rising Wedge. It broke down with a gap, which is the bearish resolution. The measured-move implication is a retest or break of the $31.2–31.5 lows.
- Possible Bullish Double Bottom: The lows near $31.0–31.5 (Oct 19–20 and Oct 30) could form a double bottom. This needs a rally above the neckline around $35.5–36 to confirm, which is well beyond a 6-day horizon, so it is only an optional bullish case.
- Gap fill: The gap-down zone of $34.4–$34.5 is the logical upside magnet and key resistance if the bounce extends.
POTENTIAL SCENARIOS
- Scenario 1: Bearish Bounce Fails at EMAs — The relief rally stalls at EMA13/EMA34 ($33.12–$33.77), −DI stays on top, and price slips back below SMA200 toward VWAP and the recent lows. Trigger: rejection at $33.1–$33.8 and a close below $32.67. Target: $32.30, then $31.50. Invalidation: a sustained close above $33.80. (50% probability)
- Scenario 2: Bullish Oversold Reversal / Gap Fill — SMA200 holds, RSI pushes above 50, MACD histogram turns up and price reclaims EMA34. Trigger: a close above $33.80 on rising volume. Target: $34.40–$35.00 (gap fill and Bollinger midline). Invalidation: a close below $32.30. (35% probability)
- Scenario 3: Neutral Chop Around SMA200 — Price oscillates between $32.0 and $33.5 as the bounce and the downtrend offset each other. Trigger: repeated closes between VWAP and EMA13. Target: $32.7–$33.2. Invalidation: a close outside $31.80–$33.80. (15% probability)
PRICE TARGETS
- Target Price: $32.30 (6-day)
- Expected Range: $31.20 to $33.60 (width $2.40, about 7.3% of current price, consistent with the 4–8% guidance for a 6-day window)
- Key Levels: Support at $31.48 (recent swing low, with SMA200 at $32.67 as first support), Resistance at $33.77 (EMA34, with EMA13 at $33.12 as first resistance)
OVERALL BIAS
OVERALL BIAS: BEARISH - Price is below both EMAs and a declining SMA50, with a fresh MACD bearish cross, a strong ADX of 31.5 with −DI above +DI, and an unfilled gap-down overhead. The current rebound looks like an oversold relief bounce into EMA resistance, though SMA200 and the recovering RSI/CMF keep conviction modest.
This is educational analysis and not financial advice.