TLT 4-day bullish forecast — Nov 1, 2026
- Bias: Bullish
- Timeframe: 4 days (made Nov 1, 2026, target date Nov 4, 2026)
- Price at analysis: $81.84
- Price target: $82.25
- Expected range: $80.45 – $83.25
- Result: Correct (+0.1%) — closed at $81.90 on Nov 4, 2026; quality score 100/100
Get a free AI analysis of TLT today
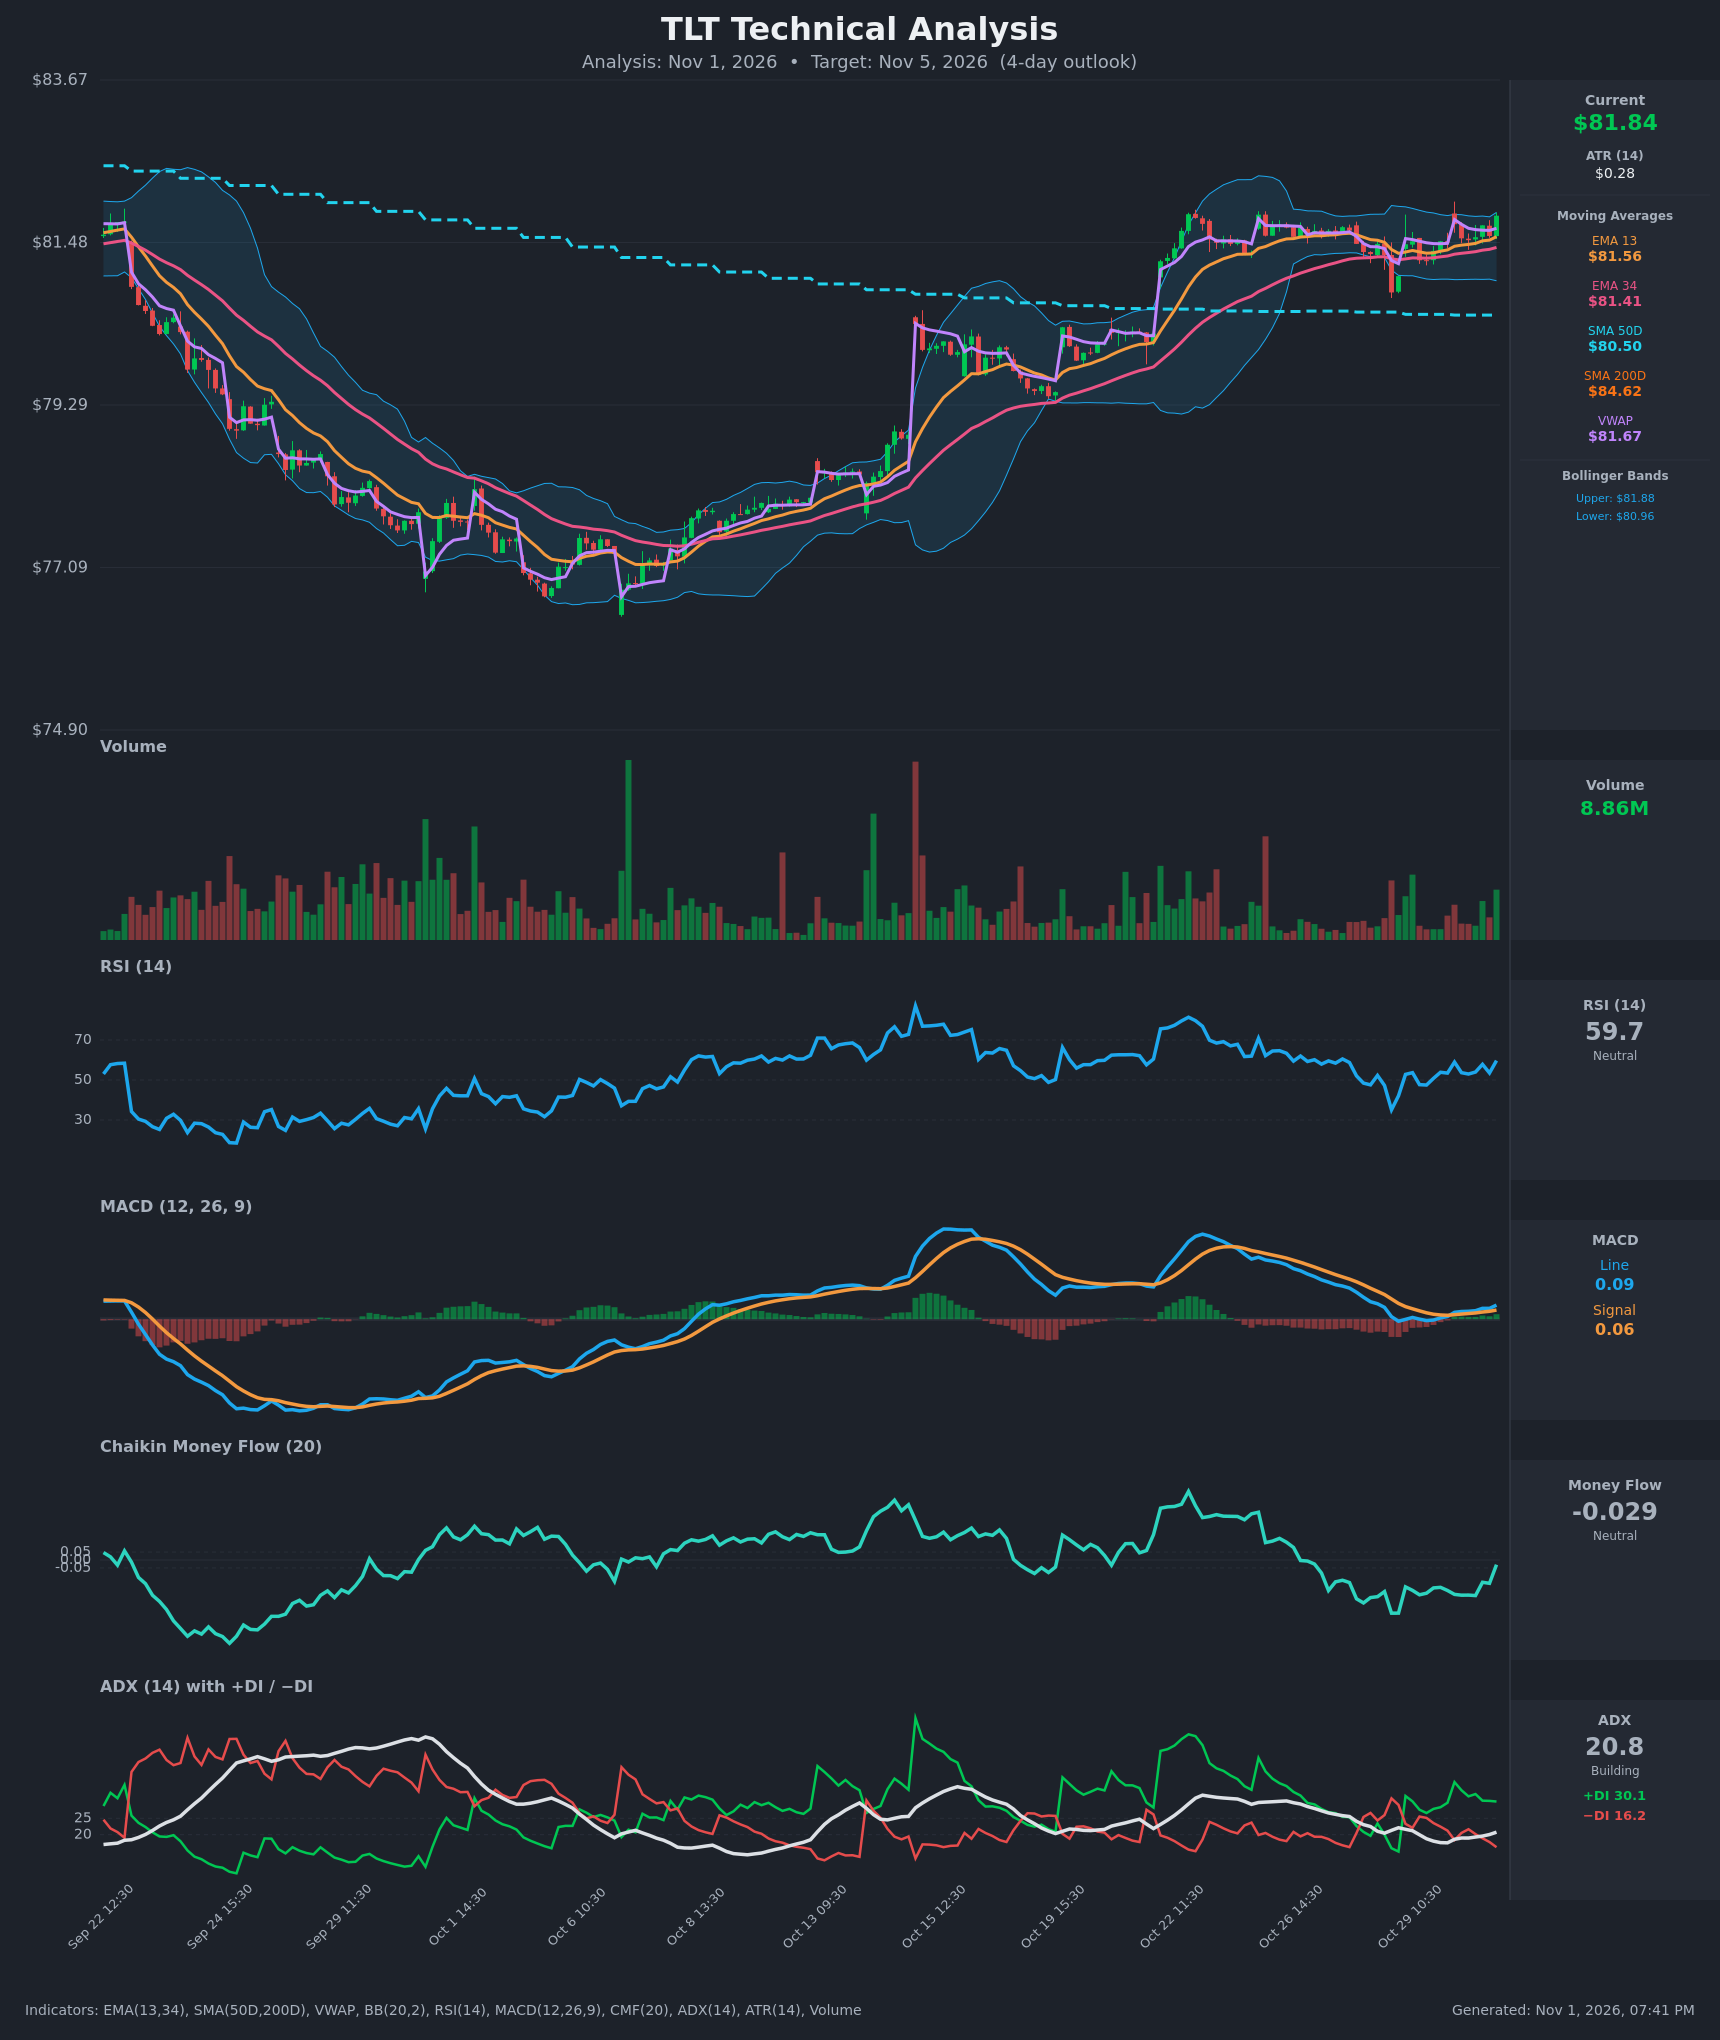
Analysis
TECHNICAL INDICATORS
- RSI (14): 59.7, rebounding from about 53 over the last few bars and up from the 34 low on Oct 28. It has room before 70 and is not overbought. [Bullish]
- 20 EMA: Only EMA 13 ($81.56) and EMA 34 ($81.41) are provided, so I use them as the short-term proxy. Price at $81.84 is above both, and EMA 13 is above EMA 34, a bullish alignment that now acts as support. [Bullish]
- MACD: Line 0.089 is above signal 0.058, with a positive and widening histogram. The line crossed above the signal on Oct 29-30 and is still rising, though it sits near the zero line. [Bullish]
- Bollinger Bands (20): Price at $81.84 is just under the upper band ($81.88), well above the midline (about $81.42), and the bands are narrow ($80.96-$81.88). A narrow band means compression, and price pressing the upper band hints at an upside expansion. It can also mean a short-term stretch. [Bullish]
- CMF (20): -0.029 sits in the neutral zone, but it has recovered sharply from -0.22 within a few bars. Accumulation is improving, but it has not yet confirmed. [Neutral]
- ADX (14): 20.8 and rising from 17.5, so a trend is only just building. +DI 30.1 is well above -DI 16.2, so bulls are in control. [Weak/Building Trend, Bullish direction]
- Volume: 8.86M on the latest bar, a green bar and above the quiet recent volume. It is not a major breakout spike, but it supports the late-session push to the highs. [Mildly Bullish]
DIVERGENCES & TRENDS
- There is no clear price/indicator divergence. RSI, MACD and +DI are all rising with price.
- The MACD bullish crossover (Oct 29-30) and the +DI/-DI spread (30.1 vs 16.2) show improving momentum.
- EMA 13 is above EMA 34, and price is above VWAP ($81.67), which indicates buyers are in control intraday.
- SMA 50D ($80.50) is below SMA 200D ($84.62), so there is no golden cross and the long-term trend is still down. Price is well below SMA 200D, which is overhead resistance far from the current price.
- ADX is below 25, so there is no strong trend yet. The recent price action is a tight consolidation between roughly $81.2 and $82.3.
CHART PATTERNS
- The sideways consolidation under flat resistance (about $82.2-$82.3) after the Oct 22 advance resembles a Bullish Flag / Ascending Triangle continuation from the reference diagram. Lows are creeping higher around $81.2-$81.4 against flat highs.
- A breakout above about $82.30 would project a measured move of roughly $0.9-$1.1 (prior pole height), pointing to about $83.2.
- A failed breakout and drop below $81.40 would turn this into a range, with a downside test near $80.95 (the lower Bollinger Band).
POTENTIAL SCENARIOS
- Scenario 1: Bullish Breakout From Consolidation — Price holds above the EMAs and VWAP and pushes through the flat resistance as MACD and +DI keep expanding. Trigger: close above $82.30 with volume. Target: $82.25-$83.20. Invalidation: close below $81.40. (50% probability)
- Scenario 2: Neutral Range-Bound Chop — Price stays in the $81.20-$82.30 range with ADX stuck near 20, and the upper Bollinger Band caps gains. Trigger: repeated rejections near $82.0-$82.3. Target: $81.50-$82.00. Invalidation: close outside $81.20-$82.30. (30% probability)
- Scenario 3: Bearish Failed Breakout — A rejection at the upper band and resistance sends price back through the EMAs, and the long-term downtrend below the SMA 200D reasserts. Trigger: close below $81.40. Target: $80.95-$80.50 (lower band, SMA 50D). Invalidation: reclaim of $81.85. (20% probability)
PRICE TARGETS
- Target Price: $82.25 (4-day horizon)
- Expected Range: $80.45 to $83.25 (width $2.80, about 3.4% of the current price, consistent with the 4-day guidance)
- Key Levels: Support at $81.41 (EMA 34, with EMA 13 at $81.56 just above it), Resistance at $82.30
OVERALL BIAS
OVERALL BIAS: BULLISH - Price is above its short-term EMAs and VWAP, MACD crossed bullish, +DI dominates -DI, RSI is rising, and CMF is recovering toward positive. The consolidation under flat resistance resembles a bullish continuation setup, though the weak ADX and the distant SMA 200D limit conviction.
This is educational analysis and not financial advice.