TLT 20-day bearish forecast — Nov 15, 2026
- Bias: Bearish
- Timeframe: 20 days (made Nov 15, 2026, target date Dec 4, 2026)
- Price at analysis: $79.38
- Price target: $78.20
- Expected range: $74.90 – $82.40
- Result: Pending — graded after the close on Dec 4, 2026
Get a free AI analysis of TLT today
Analysis
TECHNICAL INDICATORS
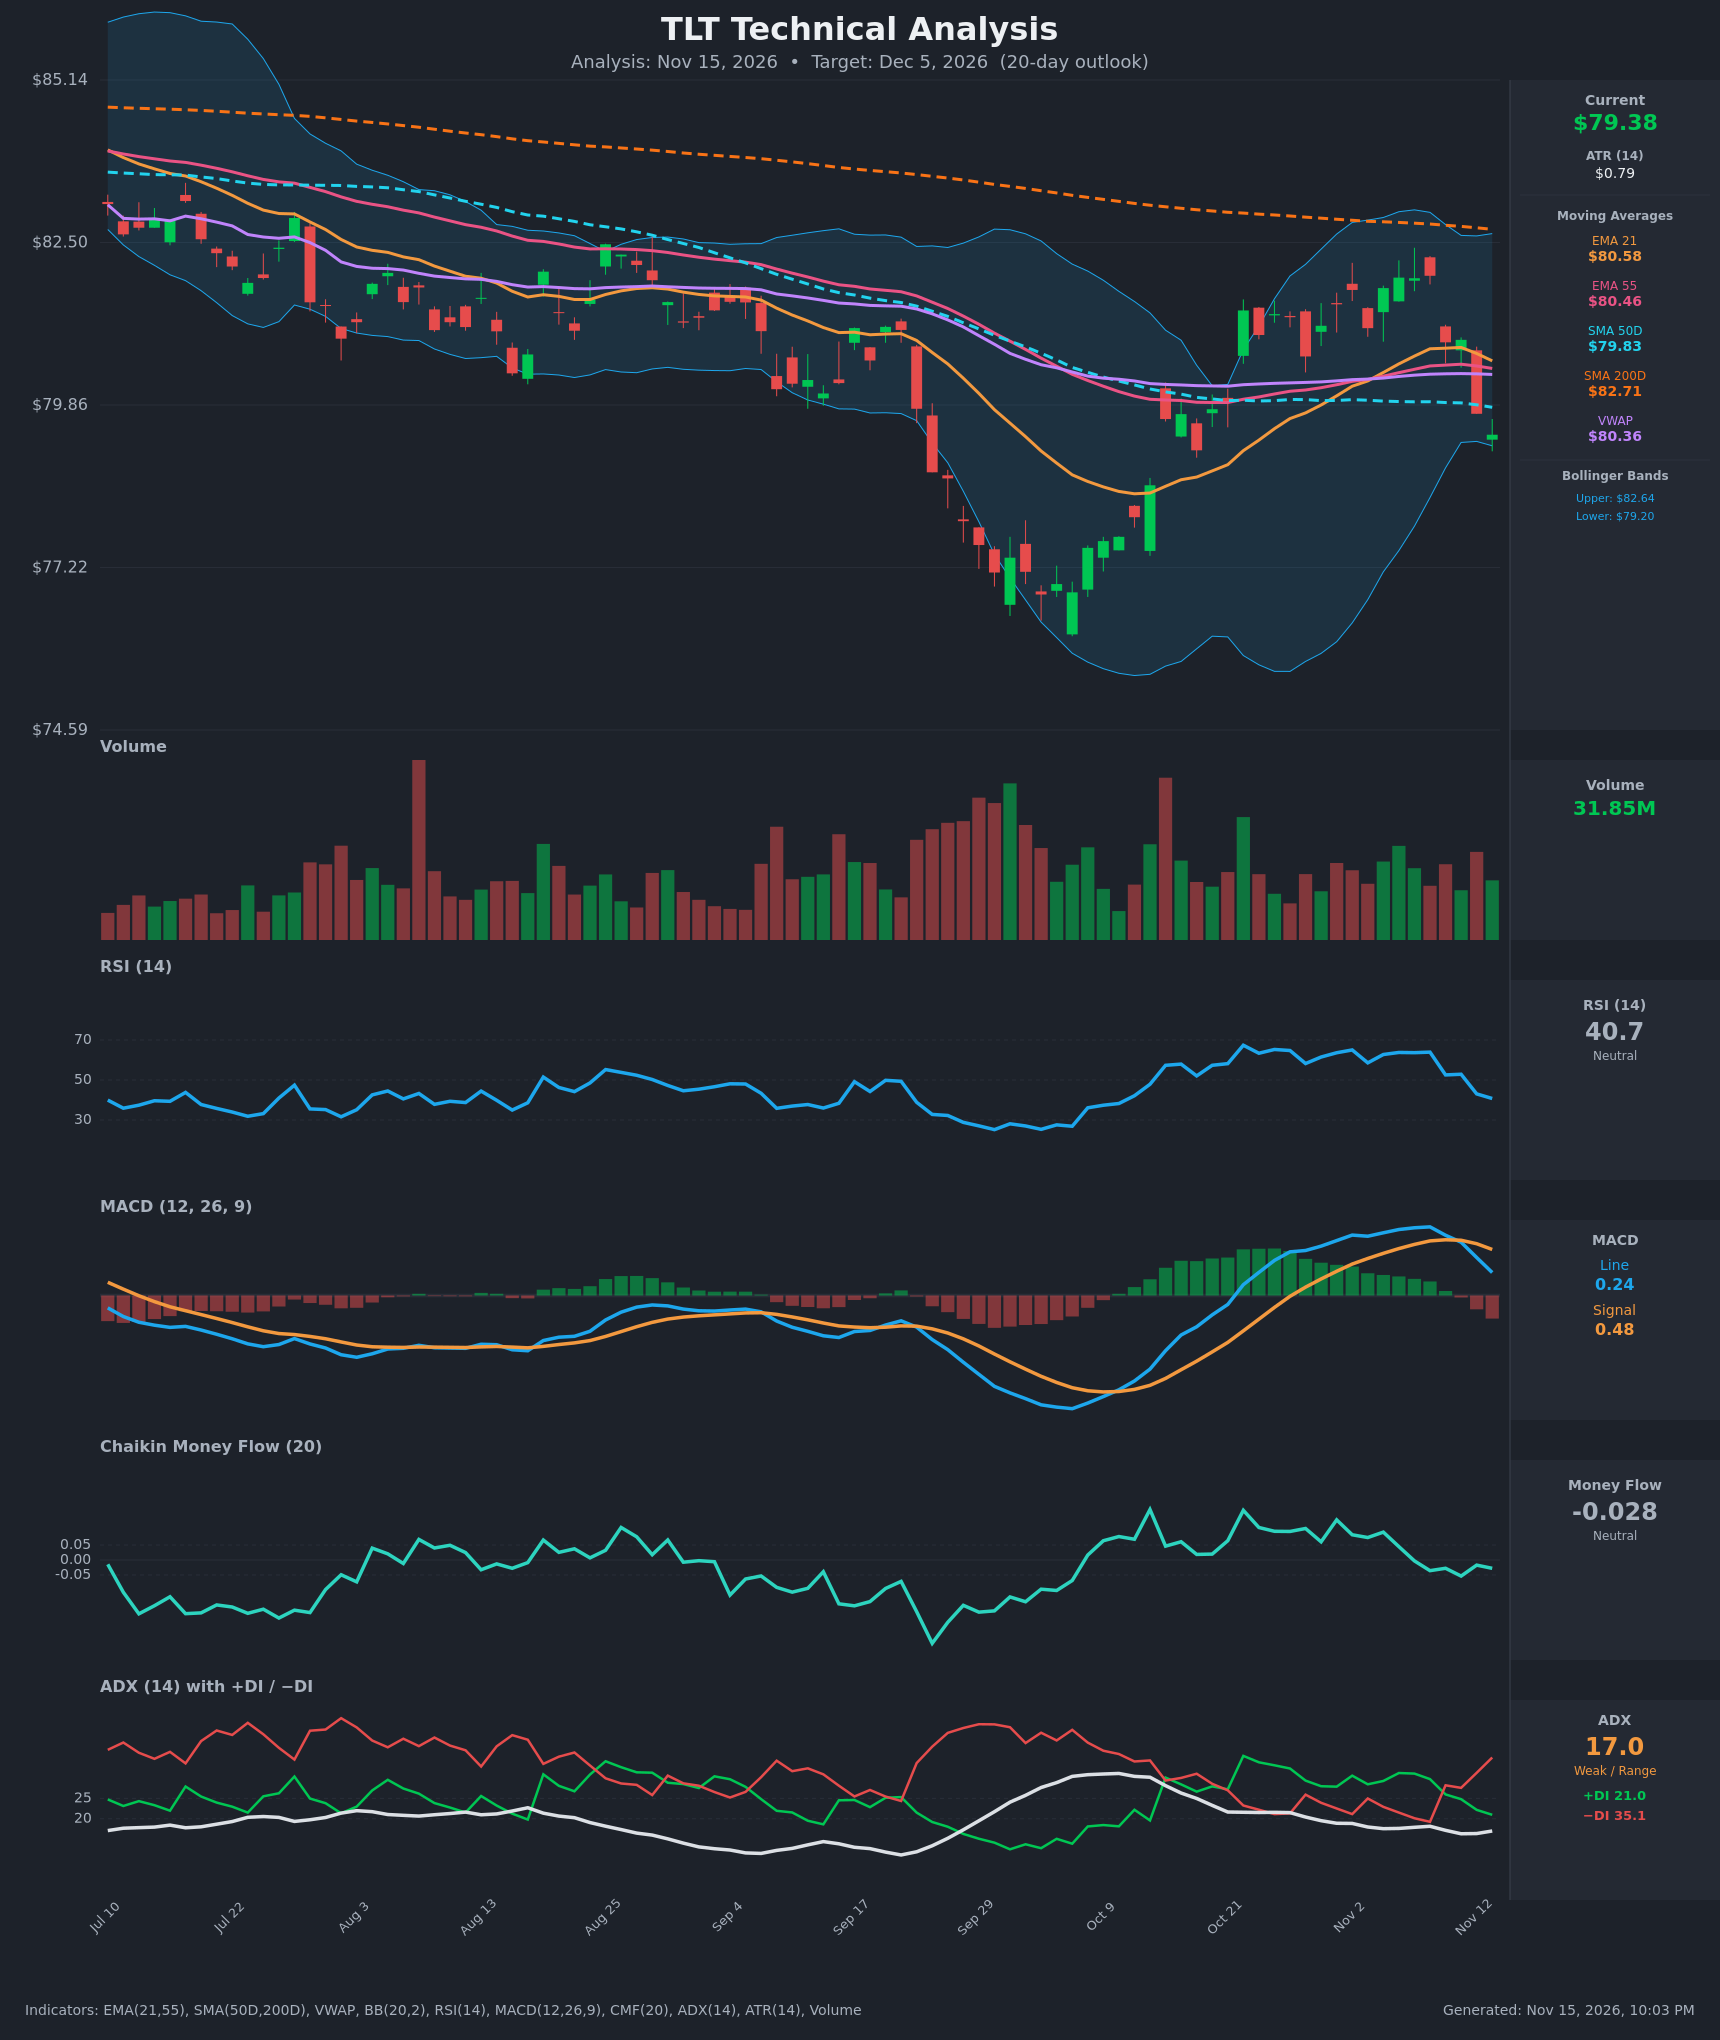
- RSI (14): 40.75, down sharply from about 64 on Nov 9 and now approaching the 30-40 zone. Momentum is clearly falling but not yet oversold. [Bearish]
- 20 EMA: The EMA 21 is $80.58 and price at $79.38 is about 1.5% below it. EMA 21 has just rolled over and crossed back below its recent peak, and it now acts as resistance. EMA 21 is still marginally above EMA 55 ($80.46), but the gap is closing. [Bearish]
- MACD: Line 0.238 has crossed below the signal at 0.477, and the histogram has turned negative (about -0.24) and is widening. This is a fresh bearish crossover from a high level. [Bearish]
- Bollinger Bands (20): Upper $82.64, lower $79.20. Price at $79.38 is hugging the lower band, and the bands are narrowing, which suggests a possible volatility contraction. A band walk lower is possible, but a touch of the lower band often precedes a bounce toward the midline (~$80.9). [Neutral]
- CMF (20): -0.028, which is within the neutral zone (±0.05). It has faded from +0.13 at the end of October, so buying pressure has dissipated, but there is no clear distribution yet. [Neutral]
- ADX (14): 17.0 (weak/range-bound), with −DI 35.1 well above +DI 21.0. The bears have taken control after the DI crossover on Nov 10, but the low ADX shows the trend is not yet established. [Weak Trend, Bearish direction]
- Volume: 31.85M, near average, with the recent selloff bars (Nov 10 and Nov 12) on moderate to above-average volume. This confirms some selling pressure without a capitulation spike. [Mildly Bearish]
DIVERGENCES & TRENDS
- No clear divergence. RSI and MACD are confirming the price drop (lower RSI, falling MACD).
- The price is below the VWAP ($80.36), EMA 21 and EMA 55, and below the SMA 50D ($79.83). It lost the SMA 50D on the most recent bar, which is a short-term breakdown.
- SMA 50D ($79.83) is well below SMA 200D ($82.71), so there is no golden cross. The longer-term structure remains a downtrend, with price below the declining 200D.
- The rally from the late-Sep low (~$76.5) to ~$82 on Nov 9 failed beneath the 200D and the upper Bollinger band, and has now retraced about 55-60%.
- The MACD bearish crossover and the −DI crossover both occurred in the last 3-4 sessions.
CHART PATTERNS
- The pattern is closest to a Bearish Double Top / rounded top structure. The failed highs at ~$82 in early Nov, below the 200D SMA, form the second peak after the late-Oct high, with the neckline near $79.8-80.0 (the SMA 50D area) now being broken.
- The measured move from the ~$82 peak to the neckline (~$2) would project toward ~$77.8-78.0, which is near the prior late-Sep/Oct support zone.
- The lower low at ~$79.2 also vaguely resembles the start of a Bearish Flag following the failed rally, but the evidence is weak.
- The tight sideways range between $79.2 and $82.0 could also be a consolidation, but the ADX at 17 and the DI structure favor a downside resolution.
POTENTIAL SCENARIOS
- Scenario 1: Bearish Breakdown Continuation — Price loses the SMA 50D/lower Bollinger band and continues down as the double-top neckline gives way, with MACD and −DI dominance continuing. Trigger: Daily close below $79.00 on rising volume. Target: $77.80-$78.20. Invalidation: Daily close back above $80.60 (EMA 21 / VWAP). (50% probability)
- Scenario 2: Neutral Range Bounce — The lower band and the SMA 50D hold, and price oscillates between $78.80 and $80.80 as RSI resets near 35. Trigger: Hold of $79.00 with a bullish reversal candle. Target: $80.30-$80.80. Invalidation: Close below $78.70. (30% probability)
- Scenario 3: Bullish Reversal — Oversold bounce after the sharp two-day drop, with a push back above EMA 21 and VWAP toward the upper band. Trigger: Close above $80.90 with CMF turning positive. Target: $82.00-$82.60. Invalidation: Failure at the 200D SMA (~$82.70) or a close below $79.00. (20% probability)
PRICE TARGETS
- Target Price: $78.20 (20-day horizon)
- Expected Range: $74.90 to $82.40 (width $7.50 ≈ 9.4%, scaled for a 20-day horizon with ATR of $0.79)
- Key Levels: Support at $77.50, Resistance at $80.60
OVERALL BIAS
OVERALL BIAS: BEARISH - MACD has crossed bearishly, −DI dominates +DI (35.1 vs 21.0), price has fallen below the SMA 50D, EMA 21 and VWAP, and the rally failed below the declining SMA 200D, pointing to a retest of the high-$77s. The weak ADX and the proximity to the lower Bollinger band limit conviction, so a bounce is possible.
This is educational analysis and not financial advice.