TLT 27-day bearish forecast — Nov 15, 2026
- Bias: Bearish
- Timeframe: 27 days (made Nov 15, 2026, target date Dec 11, 2026)
- Price at analysis: $79.38
- Price target: $77.90
- Expected range: $74.40 – $81.60
- Result: Pending — graded after the close on Dec 11, 2026
Get a free AI analysis of TLT today
Analysis
TECHNICAL INDICATORS
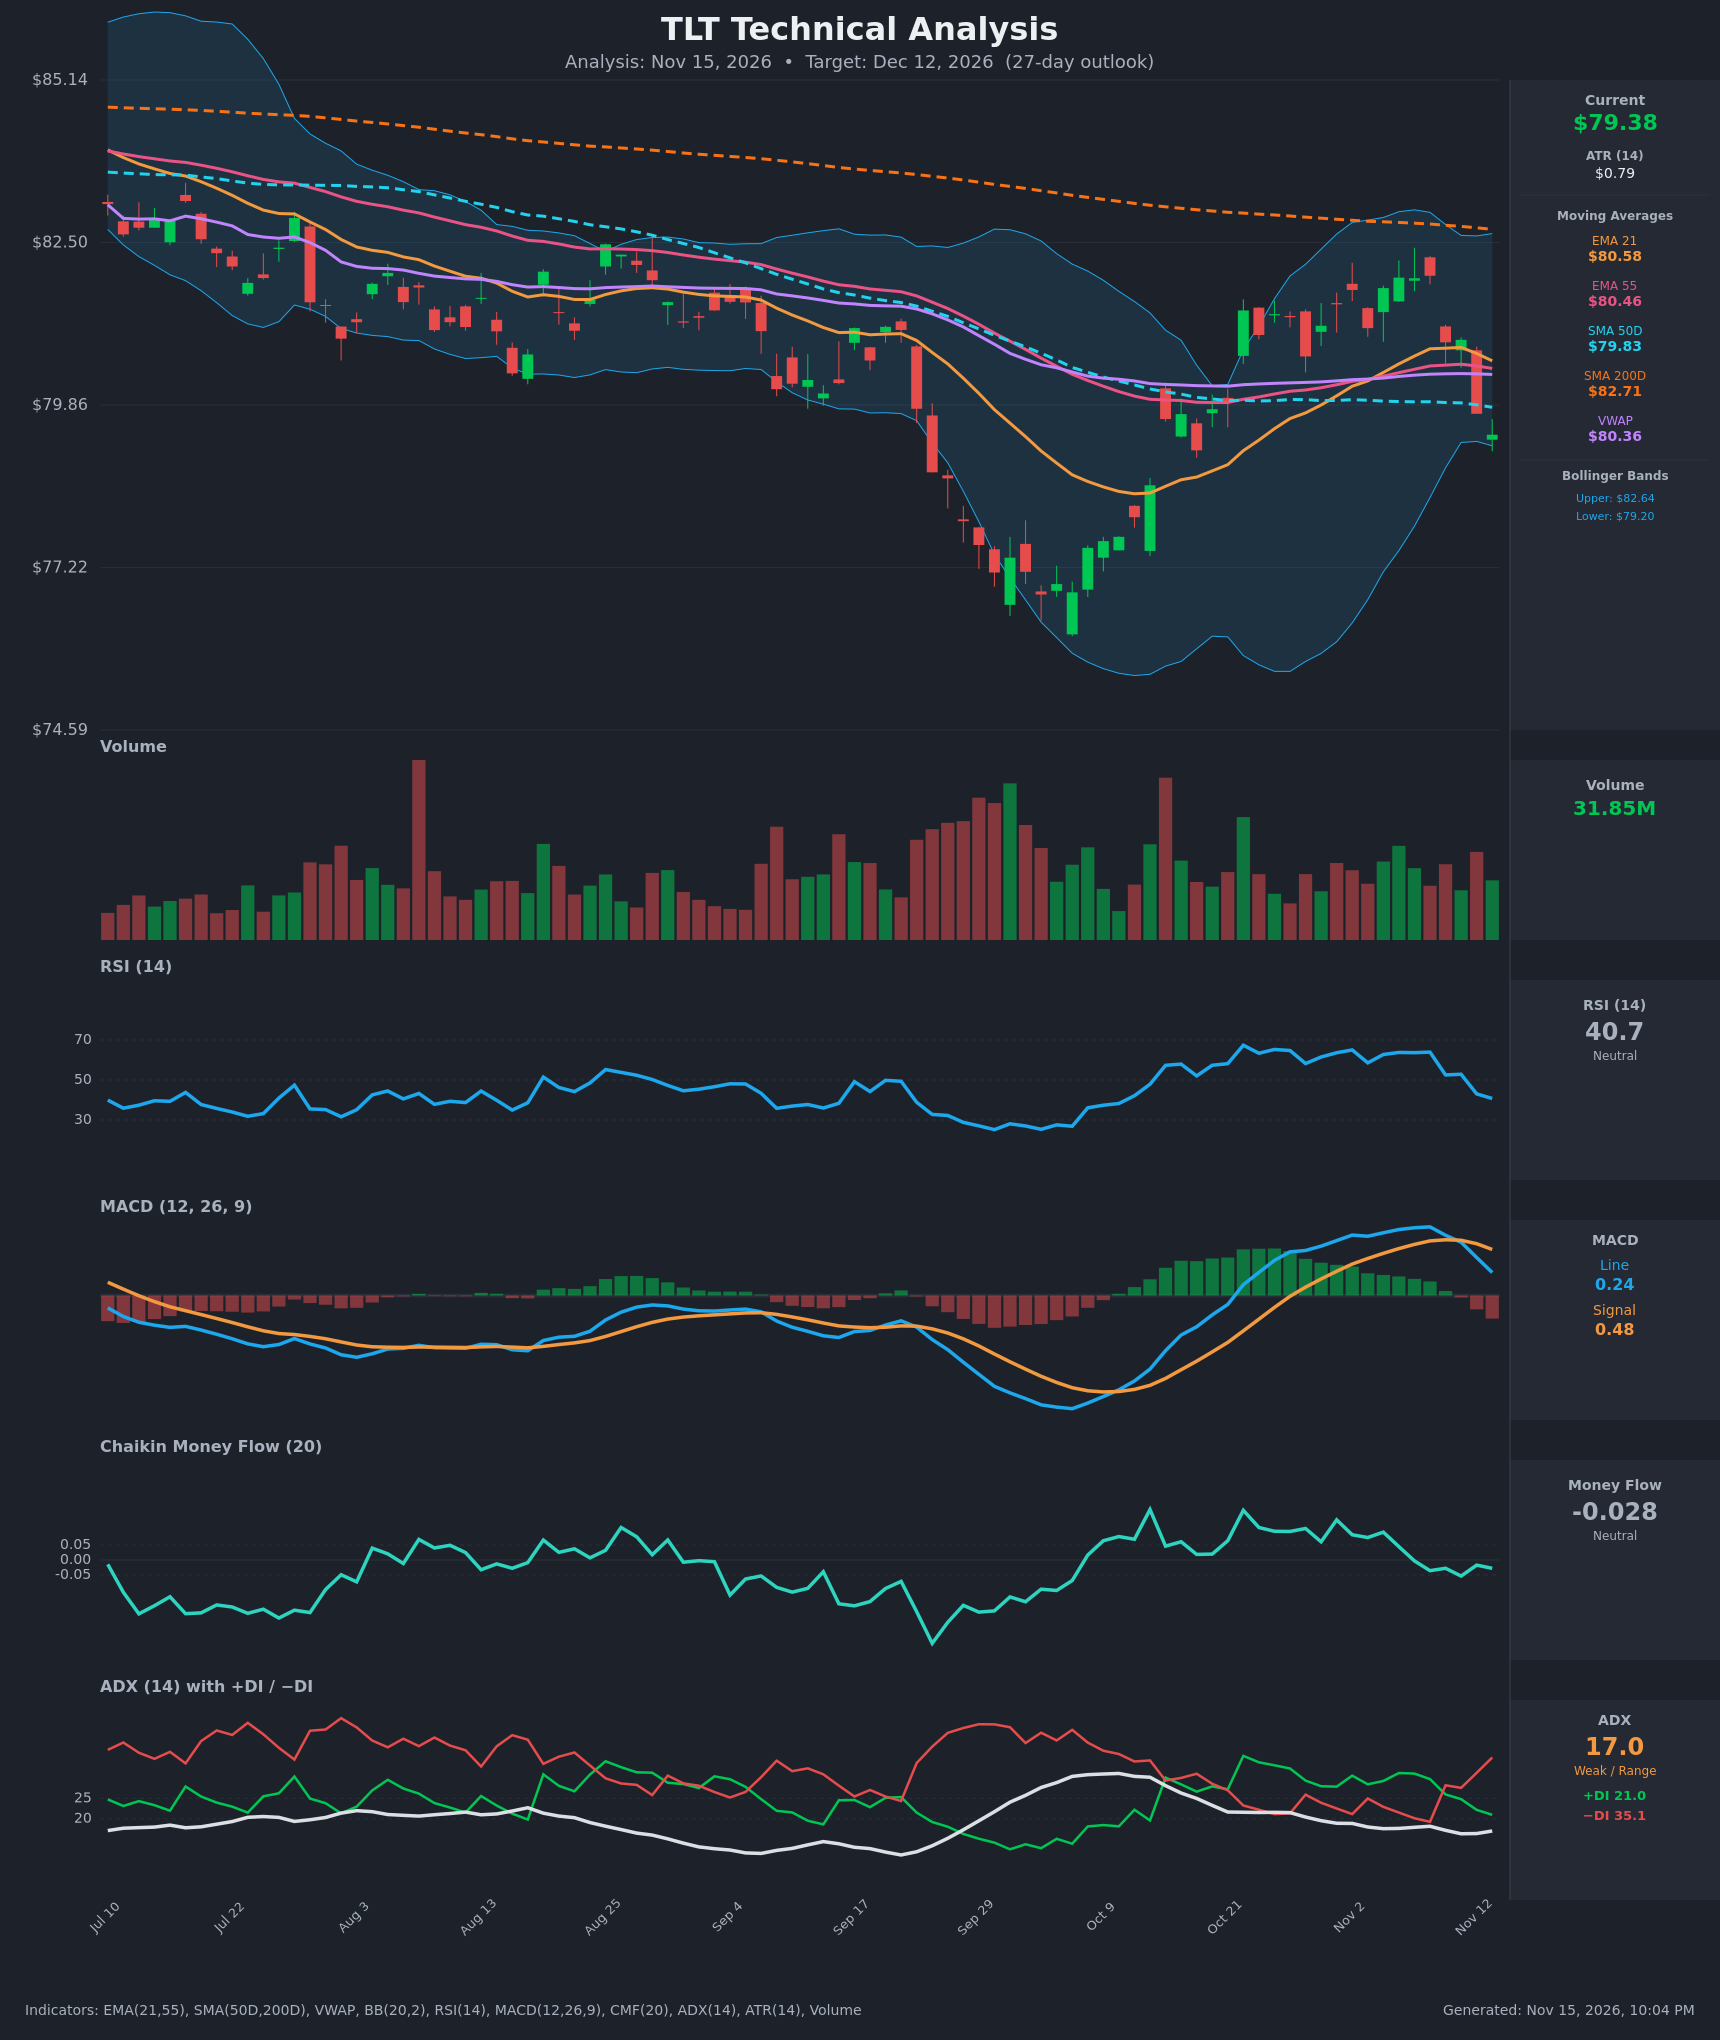
- RSI (14): 40.75, down sharply from ~64 on Nov 9 and ~52 on Nov 11. It is falling toward the 30–40 zone with no oversold reading yet, so momentum is clearly deteriorating. [Bearish]
- 20 EMA (EMA 21): $80.58, with price at $79.38 about $1.20 below it. The EMA21 has just started to roll over and now acts as overhead resistance. EMA21 is still above EMA55 ($80.46), but the gap is closing. [Bearish]
- MACD: Line 0.238 is below Signal 0.477, a bearish crossover that occurred on Nov 11. The histogram is negative and widening, and the line has rolled over from its ~0.71 peak. [Bearish]
- Bollinger Bands (20): Upper $82.64, lower $79.20. Price at $79.38 sits just above the lower band, which is a near-term stretched condition. The reversal from the upper band region (~$82) to the lower band within about 4 sessions shows a sharp momentum swing. Walking the band is possible, but a bounce toward the middle band (~$80.9) is also plausible. [Bearish]
- CMF (20): -0.028, between ±0.05, after fading from +0.13 in late October. The trend is down, with flows drifting from accumulation toward neutral and slight distribution. [Neutral]
- ADX (14): 17.0 with −DI 35.1 above +DI 21.0. The trend is weak (ADX <20), but the DI spread is wide and −DI is rising, so bears have regained control. [Weak Trend + Bearish direction]
- Volume: 31.85M on the latest bar, with heavy red volume on the Nov 10 and Nov 12 breakdown candles. The selling has been done on decent participation, so the decline looks real rather than a drift. [Bearish]
DIVERGENCES & TRENDS
- No clear bullish divergence: RSI is making lower lows alongside price, and MACD is confirming the decline.
- Price has fallen below EMA21, EMA55, VWAP ($80.36) and now sits just under the SMA50D ($79.83). A close below the SMA50D after weeks of holding is a bearish break.
- The SMA200D ($82.71) is well overhead and still sloping down, so the long-term trend remains down. SMA50D remains below SMA200D (death cross in effect).
- The MACD bearish crossover on Nov 11 and the DI flip (−DI over +DI since Nov 10) both support the downside.
- The Oct rally from the ~$76.5 low (Sep/Oct) stalled below the SMA200D near $82. That is a lower high versus the summer levels, and the current drop is a retracement of the rally.
- EMA21/EMA55 are converging and may cross bearishly soon. EMA21 minus EMA55 is only $0.12.
CHART PATTERNS
- Bearish Double Top / failed rally: The Nov 5–9 highs near $81.9–82.0 failed twice below the SMA200D and the upper Bollinger band. The neckline area around $79.8–80 (SMA50D and the early-Oct pivot) has just broken. The measured move is roughly $2 below the neckline, toward $77.8–78.
- Bearish Rising Wedge/Flag-like retracement: The Oct–Nov recovery is a corrective rising channel inside a larger downtrend, and a break lower favors the continuation of the primary down move.
- Targets: first $78.50, then $77.20–77.50, with the Sep–Oct low at ~$76.50 as the major support.
POTENTIAL SCENARIOS
- Scenario 1: Bearish Double-Top Breakdown Continuation — Price rejects EMA21/VWAP and the SMA50D (now resistance) and slides toward the prior consolidation and Sep–Oct support. Trigger: daily close below $79.20 (lower Bollinger band) with MACD still falling. Target: $77.50, extending to $76.80. Invalidation: daily close above $80.60 (EMA21/VWAP). (50% probability)
- Scenario 2: Neutral Oversold Bounce and Range — RSI approaches 30–35, price bounces to the middle band and chops between $78 and $80.80 as ADX stays <20. Trigger: hold of $78.50 and a RSI turn. Target: $80.30–80.80. Invalidation: close below $78.00. (30% probability)
- Scenario 3: Bullish Failed Breakdown Recovery — Dip buyers defend the lower band and price reclaims the SMA50D and EMA21, retesting the Nov highs. Trigger: close above $80.60 with MACD histogram turning up. Target: $81.90–82.60. Invalidation: close below $79.00 after the reclaim. (20% probability)
PRICE TARGETS
- Target Price: $77.90 (27-day horizon, ending Dec 12, 2026)
- Expected Range: $74.90 to $80.90. The width is $6.00, or about 7.6% of the current price. This is somewhat tighter than the 12–18% guidance for 30–60 days, but 27 days sits between the 14–21 day band (8–12%) and the 30-day band. The range is widened to cover the Sep–Oct low area: $74.40 to $81.20 gives a $6.80 width (~8.6%), and ATR-based volatility (~$0.79 daily, ~$4 over 27 days at 1 sigma) supports roughly $3.5 either side. Final: $74.40 to $81.60 ($7.20 width, ~9.1%).
- Key Levels: Support at $77.20, Resistance at $80.58
Final committed values: Target $77.90, Expected Range $74.40 to $81.60, Support $77.20, Resistance $80.58.
OVERALL BIAS
OVERALL BIAS: BEARISH - Price has broken below EMA21, EMA55, VWAP and the SMA50D, with a bearish MACD crossover, −DI (35.1) well above +DI (21.0), falling RSI and heavy-volume selling, all beneath a declining SMA200D. The failed rally under $82 points to a retest of the $77–78 area, though a weak ADX and a lower-band bounce keep conviction moderate.
This is educational analysis and not financial advice.