TLT 48-day bearish forecast — Nov 15, 2026
- Bias: Bearish
- Timeframe: 48 days (made Nov 15, 2026, target date Jan 1, 2027)
- Price at analysis: $79.38
- Price target: $77.60
- Expected range: $72.20 – $81.80
- Result: Pending — graded after the close on Jan 1, 2027
Get a free AI analysis of TLT today
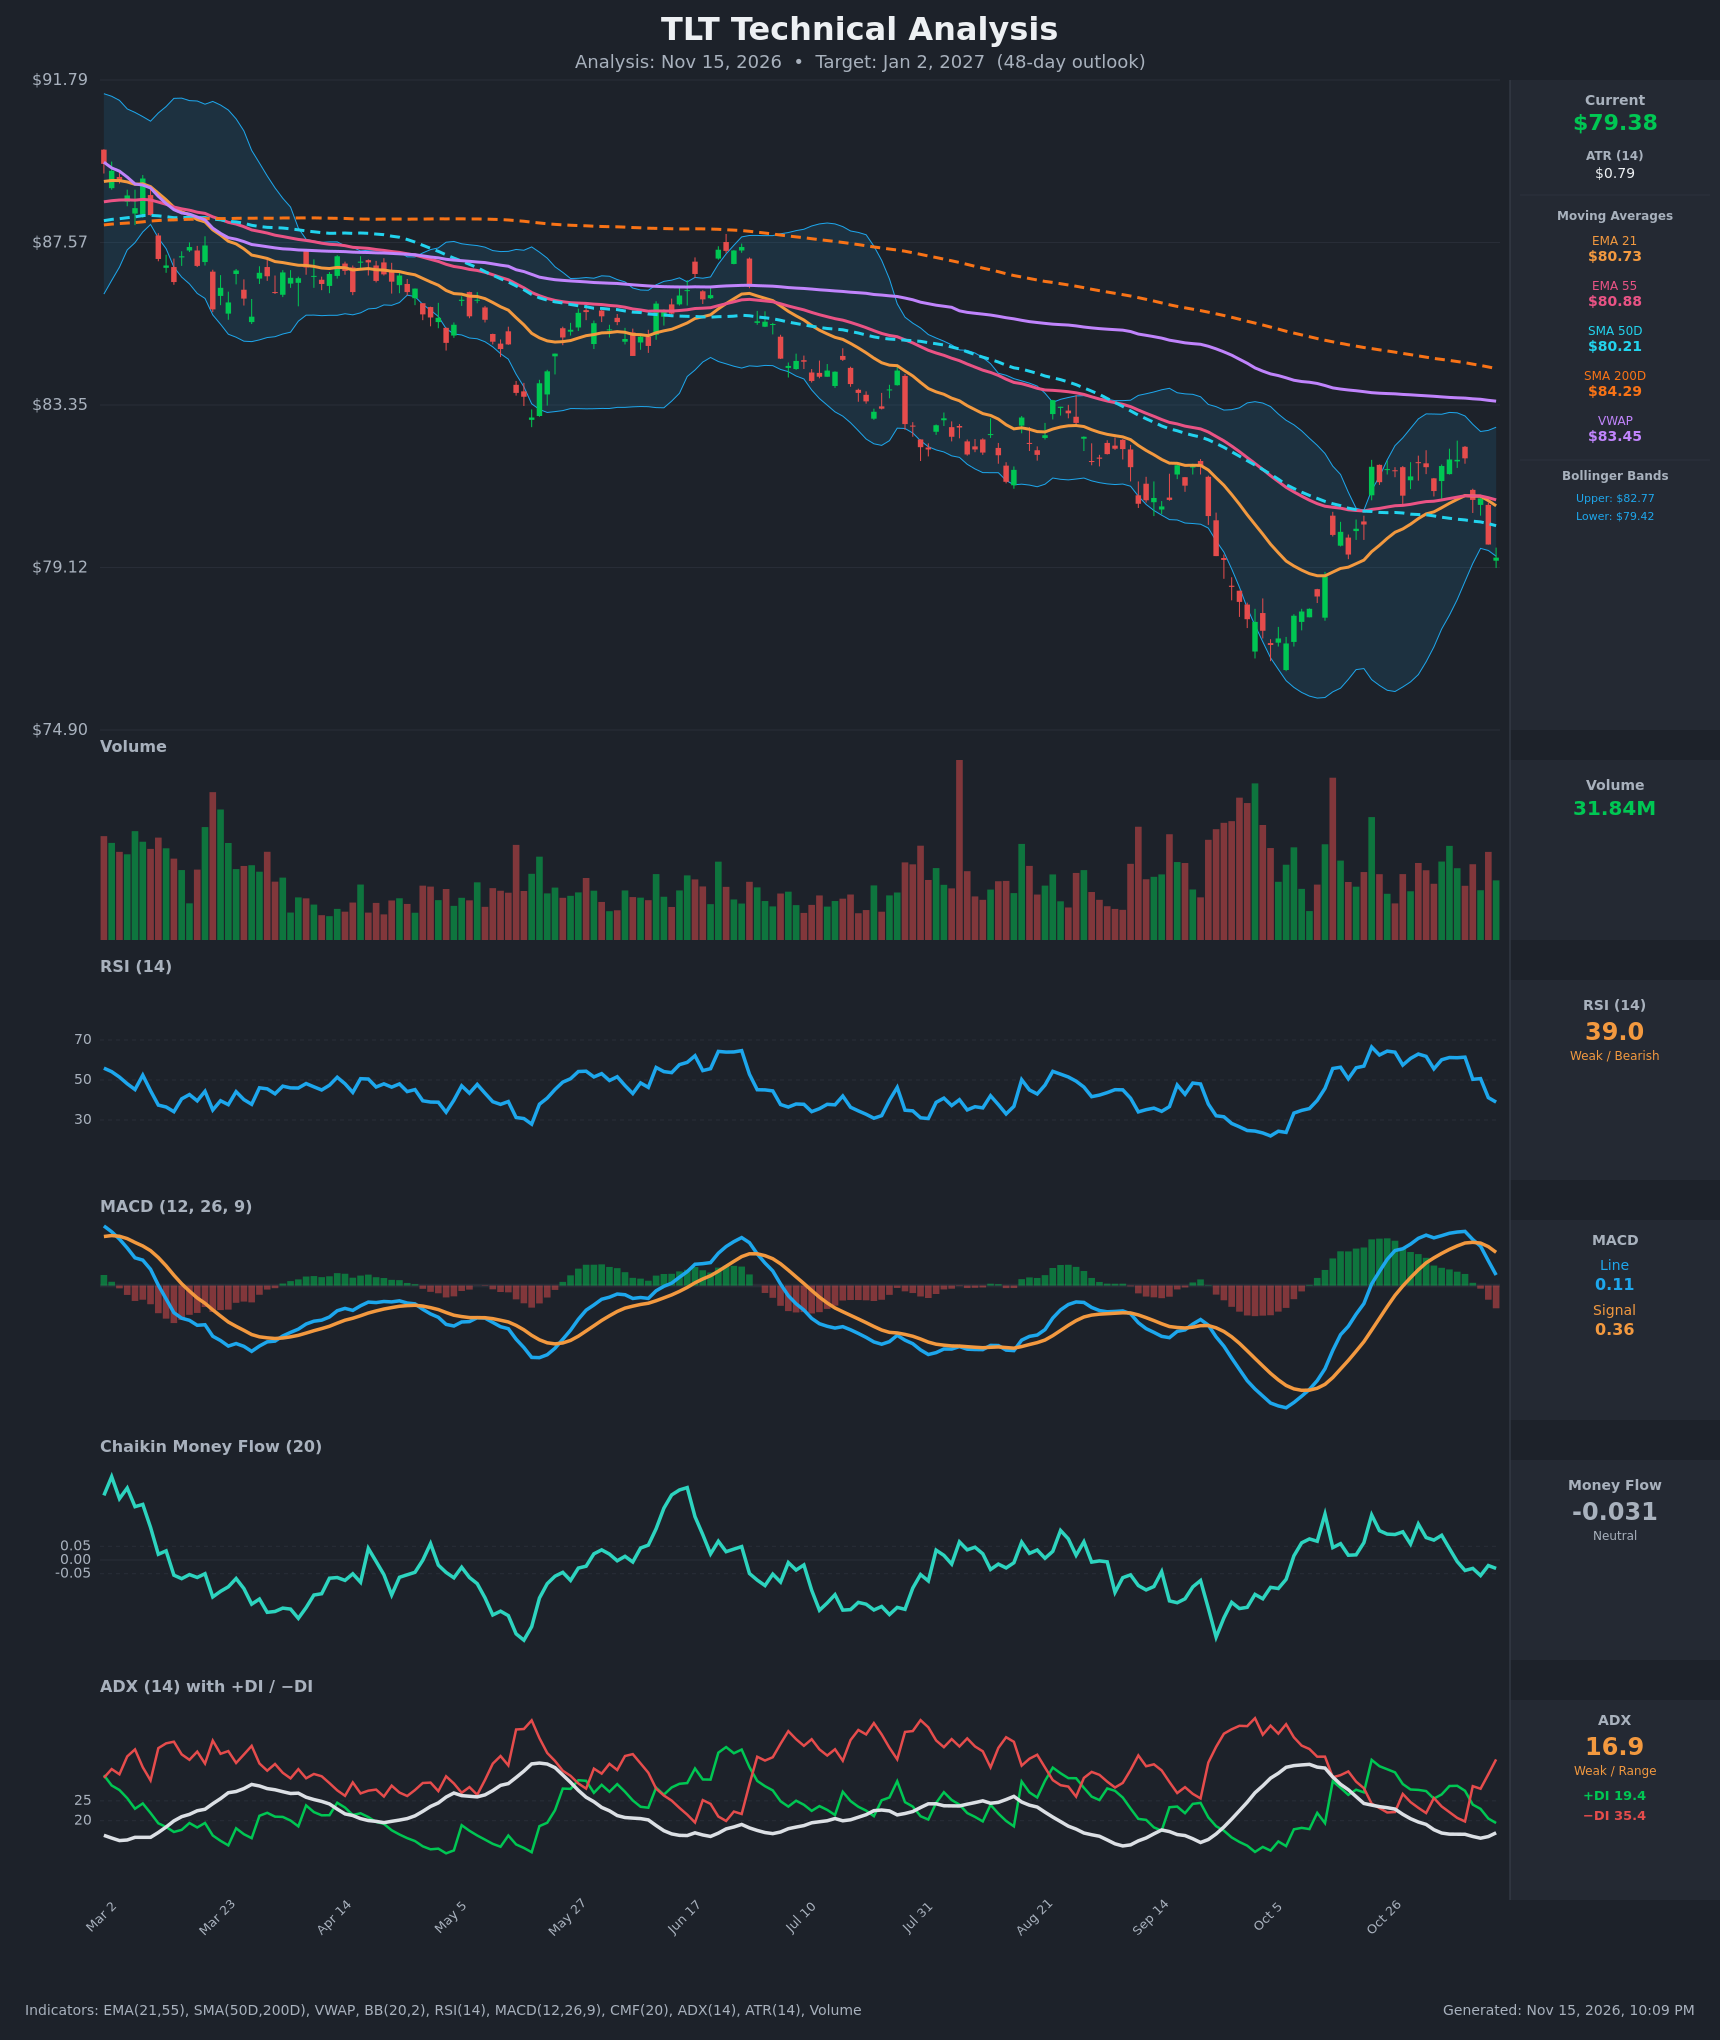
Analysis
TECHNICAL INDICATORS
- RSI (14): 38.96, down sharply from about 61 on Nov 9 and now approaching oversold. Momentum is clearly rolling over, but there is no bullish divergence yet. [Bearish]
- 20 EMA: The EMA 21 is $80.73 and price at $79.38 is below it. EMA 21 has crossed below EMA 55 ($80.88), so the EMA is now overhead resistance. [Bearish]
- MACD: Line 0.113 crossed below signal 0.356 on Nov 10-11, and the histogram has turned negative and is expanding. The line is falling fast toward zero. [Bearish]
- Bollinger Bands (20): Upper $82.77, lower $79.42. Price at $79.38 is pressing the lower band, with the bands wide after the Oct rally. A band walk would signal continuation, while a snap-back toward the mid-band (about $81.09) is possible after a stretched move. [Bearish]
- CMF (20): -0.031, down from +0.13 on Oct 30. It sits inside the neutral zone but is trending toward distribution. [Neutral]
- ADX (14): 16.9 with −DI 35.4 above +DI 19.4. The trend is weak, but the DI spread is wide and favors sellers. Direction is bearish, though the low ADX limits trend conviction. [Weak Trend, Bearish Direction]
- Volume: 31.84M, moderate. The recent down candles on Nov 10-13 carry decent volume, while the Oct bounce came on lower volume. [Mildly Bearish]
DIVERGENCES & TRENDS
- Price is below SMA200D ($84.29) and below the declining SMA50D ($80.21), a long-term downtrend. SMA50D is under SMA200D (death cross already in place), and VWAP at $83.45 is far overhead.
- The EMA 21/55 cross to the downside on Nov 10-11 confirms short-term weakness. Price is also under the SMA50D for the first time since the October rally.
- The MACD bearish cross and rapid RSI decline from 61 to 39 show momentum fading quickly. There is no bullish divergence, since the RSI is not making higher lows against price.
- The Oct bounce from about $76 to about $82 was a relief rally. It failed at the middle and upper Bollinger Band region and at the cluster of moving averages near $81-82, producing a lower high relative to the long-term downtrend.
- ADX is low (16.9) and slightly rising, with −DI expanding. This suggests a new downswing is beginning, not yet a strong trend.
CHART PATTERNS
- Bearish Double Top / lower-high structure: The October rally highs near $82 were rejected, and price is now rolling over beneath the cluster of moving averages. Breaking the Oct 28 - Nov 3 swing lows near $79-79.5 would extend the move toward the prior low.
- Broader range: Price has moved within a rebound range from about $76 to $82 since October. The break of the lower half signals a retest of the October low (about $75.7-76.5) as the measured objective.
- There is no strong bullish reversal pattern such as a double bottom or inverted head and shoulders. The October low could serve as the left base of a future double bottom if it is retested and held.
POTENTIAL SCENARIOS
- Scenario 1: Bearish Retest of October Lows — Price breaks the lower Bollinger Band and the $79 area, with the death cross, EMA cross and MACD cross all pointing down. Trigger: daily close below $79.00 with expanding volume. Target: $76.50-$77.00, a retest of the Oct low zone. Invalidation: daily close above $81.00 (EMA 21/55 reclaim). (50% probability)
- Scenario 2: Neutral Chop Near Support — Weak ADX and an oversold-leaning RSI hold price in a $77.50-$81.00 band as the market digests the move. Trigger: holds above $78 with RSI stabilizing in the 35-45 area. Target: $78-$81 range. Invalidation: close below $77.50 or above $81.50. (28% probability)
- Scenario 3: Bullish Relief Bounce — An oversold bounce reclaims the EMAs, with a possible double-bottom base. Trigger: close above $81.00 with a MACD recross. Target: $82.50-$83.50 (upper band and VWAP). Invalidation: failure at $81 and a close back below $79. (22% probability)
PRICE TARGETS
For the 48-day timeframe (30-60 day range guidance of ~12-18% of price):
- Target Price: $77.60
- Expected Range: $72.20 to $81.80 (width $9.60 ≈ 12.1% of the current price, consistent with the 12-18% guidance for 30-60 days)
- Key Levels: Support at $76.00, Resistance at $80.75
OVERALL BIAS
OVERALL BIAS: BEARISH - Price sits below all key moving averages with a death cross in place. The MACD has crossed bearish, −DI dominates at 35.4 versus 19.4, and RSI is falling fast, so a retest of the October low zone near $76-77 is the most probable path, though low ADX and near-oversold conditions warrant caution.
This is educational analysis and not financial advice.