TLT 34-day bearish forecast — Nov 15, 2026
- Bias: Bearish
- Timeframe: 34 days (made Nov 15, 2026, target date Dec 18, 2026)
- Price at analysis: $79.38
- Price target: $78.30
- Expected range: $73.60 – $83.60
- Result: Pending — graded after the close on Dec 18, 2026
Get a free AI analysis of TLT today
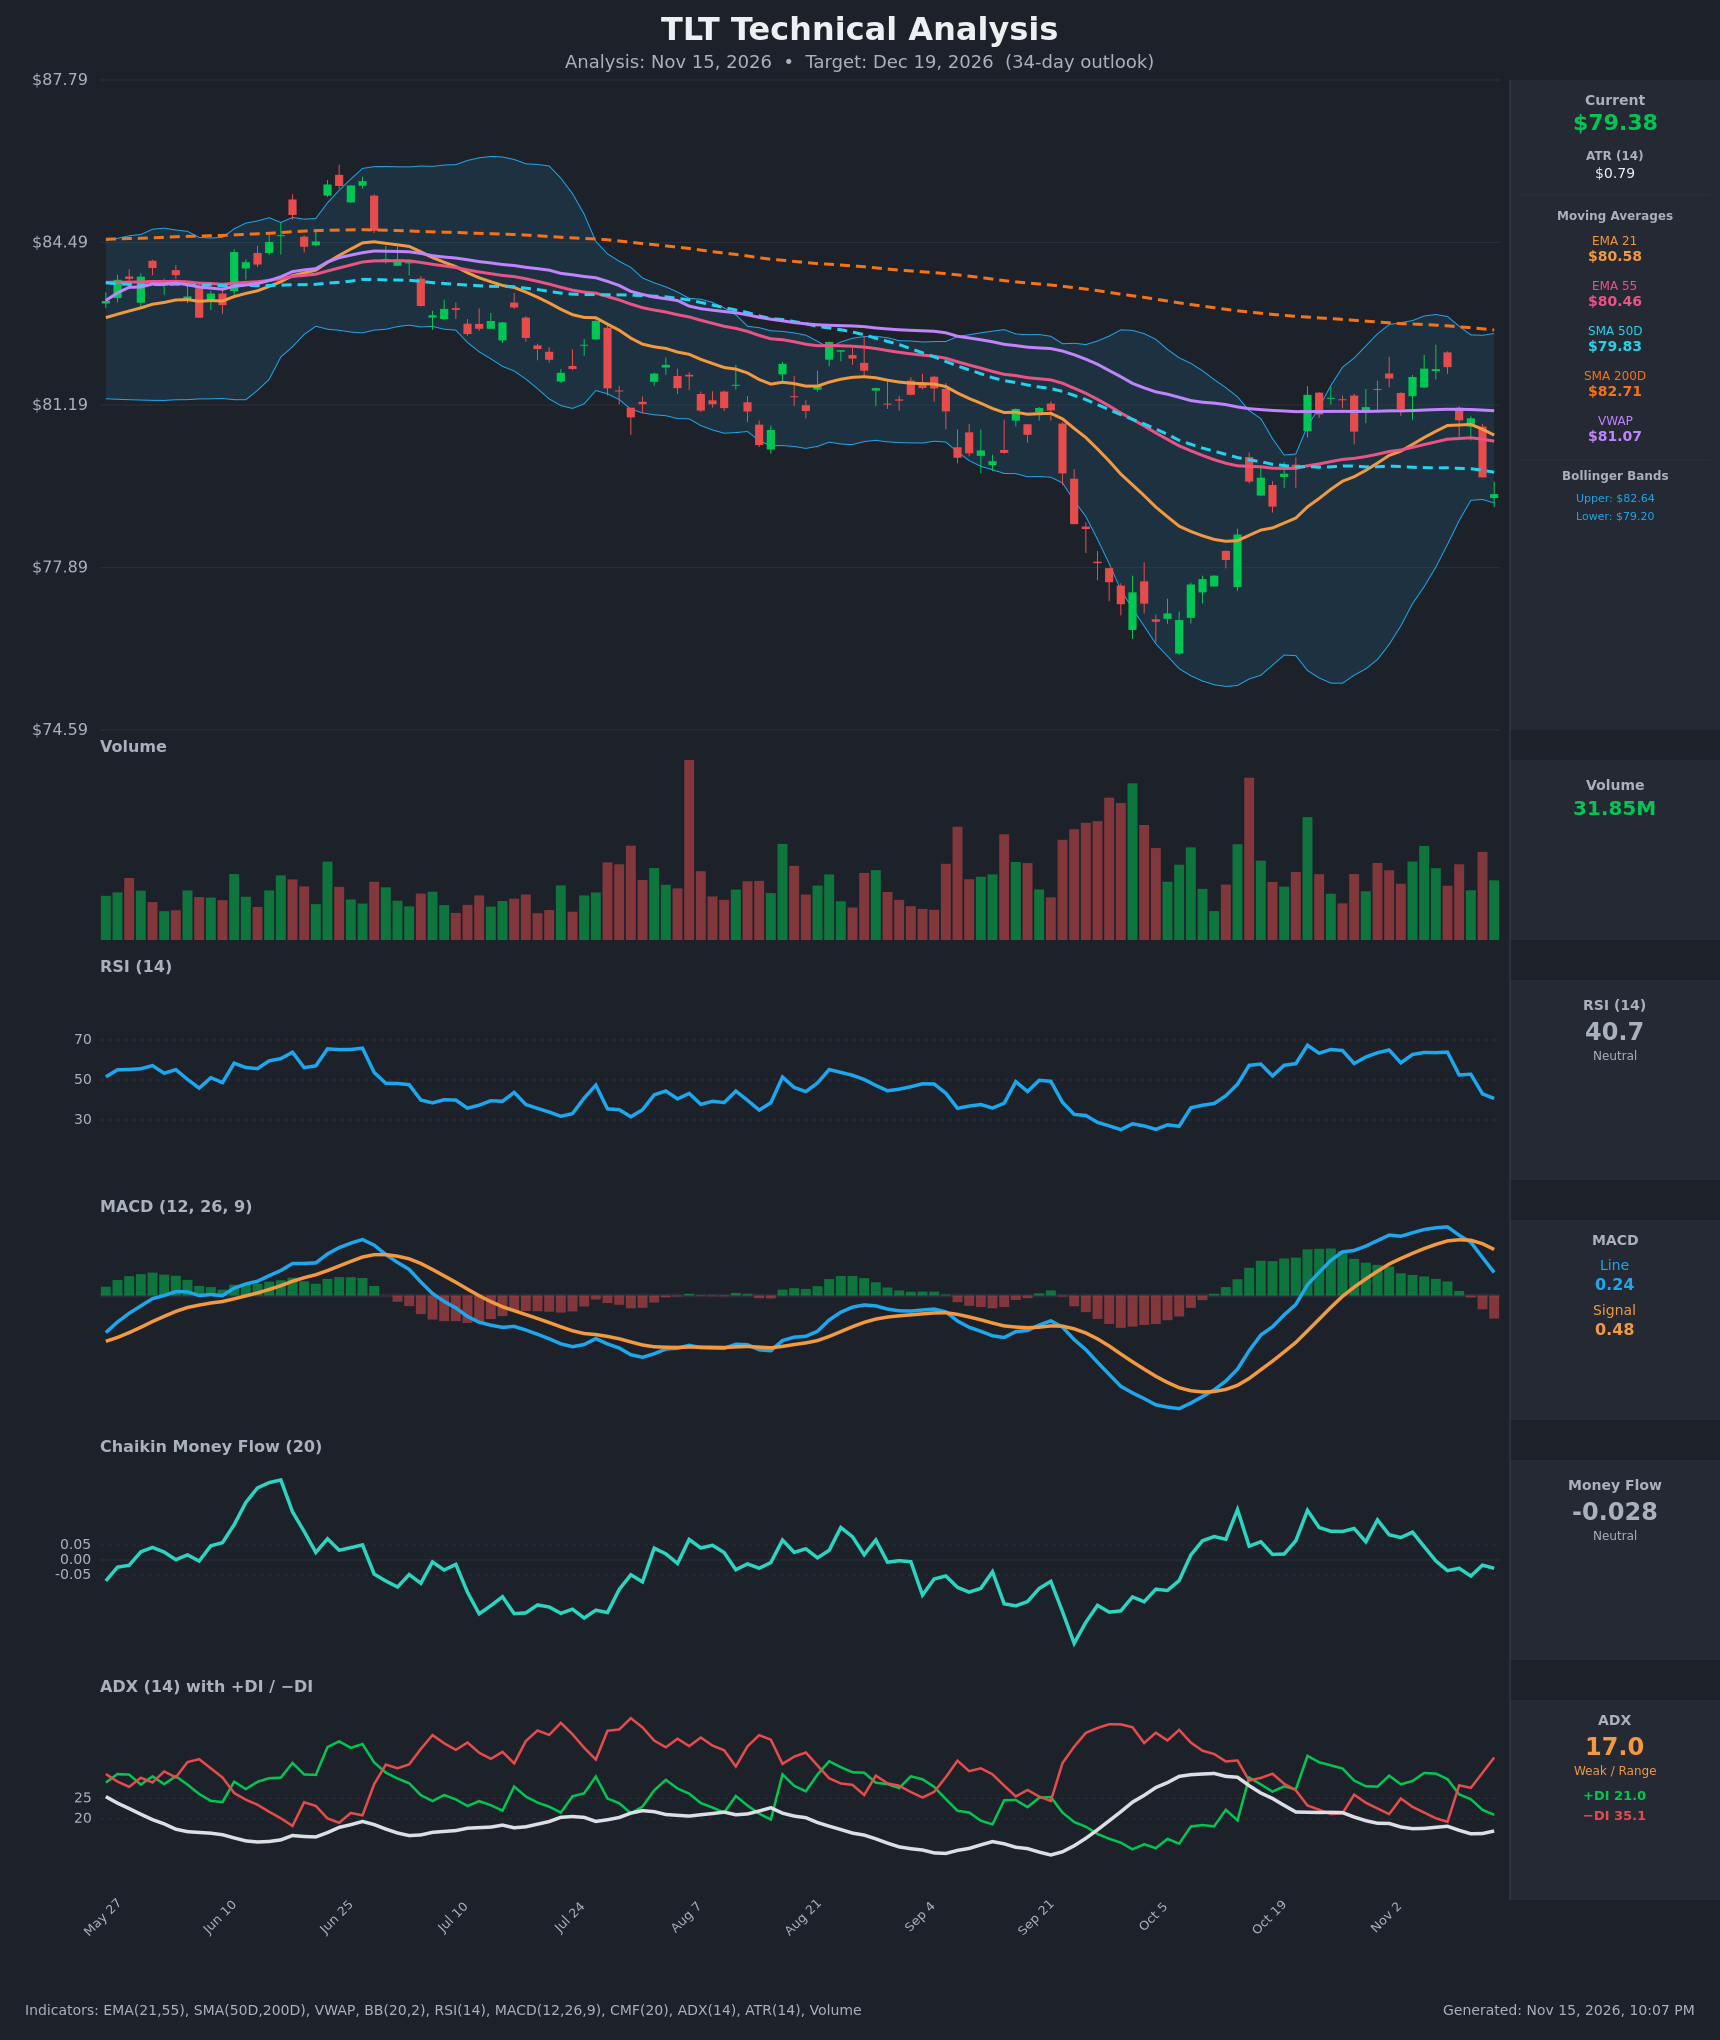
Analysis
TECHNICAL INDICATORS
- RSI (14): 40.75, down sharply from ~64 on Nov 9 (a drop of about 23 points in 4 sessions). It is below 50 and approaching the 30 oversold zone, but not yet oversold. Momentum is clearly deteriorating. [Bearish]
- 20 EMA (EMA 21: $80.58): Price at $79.38 is about 1.5% below the EMA21, which has flipped from support to resistance. The EMA21 is also rolling over and converging with the EMA55 ($80.46), so a bearish EMA cross is near. [Bearish]
- MACD: Line 0.238 is below Signal 0.477, and the bearish cross occurred around Nov 11. The histogram is negative and widening (about -0.24), and both lines are falling from their peak near 0.71. [Bearish]
- Bollinger Bands (20): Price is at $79.38, just above the lower band ($79.20), with the upper band at $82.64. Price walked from the upper half of the bands to the lower band in four sessions. The bands are fairly tight (about $3.4 wide), so a volatility expansion is possible. A touch of the lower band can bring a short-term bounce, but a close below it would signal continuation. [Bearish]
- CMF (20): -0.028, in the neutral zone (±0.05). It has faded from +0.13 at the end of October to slightly negative, a trend toward distribution without confirmed heavy selling. [Neutral]
- ADX (14): 17.0 with −DI 35.1 above +DI 21.0. The trend is weak because ADX is below 20, but the DI spread is wide and widening, so bears control the short-term direction. ADX is starting to tick up (16.3 to 17.0) as the selloff develops. [Weak Trend, Bearish direction]
- Volume: 31.85M, near average, with the recent red candles on average-to-slightly-above-average volume. There is no capitulation spike like the one in late September/October, so the pullback is not exhausted. [Mild selling pressure, no capitulation]
Other levels and moving averages:
- Price is below the SMA50D ($79.83), SMA200D ($82.71) and VWAP ($81.07), which is bearish.
- The SMA200D is still falling, and the SMA50D is flat to slightly rolling over. Price just lost the SMA50D, which was the last support.
DIVERGENCES & TRENDS
- There is no meaningful divergence. RSI, MACD and price are all falling together, so momentum confirms the price decline.
- The MACD bearish crossover (Nov 11) was a lagging confirmation of the drop that began Nov 10 with a -1.3% candle and followed on Nov 12.
- A DI crossover happened on Nov 10, with −DI moving above +DI and the gap widening to 14 points.
- Price lost the EMA21, EMA55 and SMA50D within three sessions. The rally from the Oct low (~$76.50) peaked at the SMA200D area ($82+) and failed, which is a sign of the larger downtrend persisting.
- ADX is still low, so this is not a high-conviction trend. The 34-day range may stay choppy, and a bounce off the lower band is a risk to the bearish view.
CHART PATTERNS
- Bearish Double/Triple Top (loose): Price made roughly equal highs near $81.9–$82.0 (Nov 4–9) after a prior high near $81.5. It failed below the SMA200D ($82.7). The "neckline" is the $79.2–$79.5 area, the Oct 19–Nov 12 pullback lows and the lower Bollinger Band. A decisive close below it would confirm the pattern. The measured move is roughly $82.0 − $79.4 = $2.6, giving a target near $76.8–$77.0, which aligns with the October lows.
- Overall structure: The longer-term pattern is a descending channel with lower highs since June ($85+). The Oct bounce is a counter-trend rally that hit the SMA200D.
- Caveat: Price has not yet closed convincingly below $79.20. The pattern is only confirmed on a breakdown.
POTENTIAL SCENARIOS
- Scenario 1: Bearish Neckline Breakdown — Price loses the lower Bollinger Band and the $79.20 neckline, then continues toward the October low zone. Trigger: daily close below $79.20 with expanding volume. Target: $77.00, with an extension to $76.50. Invalidation: daily close back above $80.60 (EMA21/EMA55 zone). (50% probability)
- Scenario 2: Neutral Range Chop — Price bounces off the lower band and oscillates between $79 and $81 given the weak ADX. Trigger: hold of $79.2 with RSI turning up from the 40 area. Target: $80.00–$80.60. Invalidation: close below $78.80 or above $81.10. (27% probability)
- Scenario 3: Bullish Reversal Back to Highs — The dip proves a false breakdown and price reclaims the moving averages and VWAP. Trigger: close above $80.60 and then $81.10 with MACD histogram turning positive. Target: $82.00–$82.70 (the prior highs and SMA200D). Invalidation: loss of $79.00. (23% probability)
PRICE TARGETS
- Target Price: $78.30 (34-day horizon)
- Expected Range: $73.60 to $83.60 (width $10.00, about 12.6% of current price, consistent with the 30–60 day guidance of 12–18%)
- Key Levels: Support at $77.50, Resistance at $80.60
OVERALL BIAS
OVERALL BIAS: BEARISH - Price is below the EMA21, EMA55, SMA50D, SMA200D and VWAP. MACD has crossed bearish, RSI is falling toward 40, and −DI dominates +DI. A loose double-top setup points to a retest of the low-to-mid $77s. The weak ADX (17) and price sitting at the lower Bollinger Band temper conviction and leave room for a bounce.
This is educational analysis and not financial advice.