TLT 62-day bearish forecast — Nov 15, 2026
- Bias: Bearish
- Timeframe: 62 days (made Nov 15, 2026, target date Jan 15, 2027)
- Price at analysis: $79.38
- Price target: $77.90
- Expected range: $72.60 – $82.60
- Result: Pending — graded after the close on Jan 15, 2027
Get a free AI analysis of TLT today
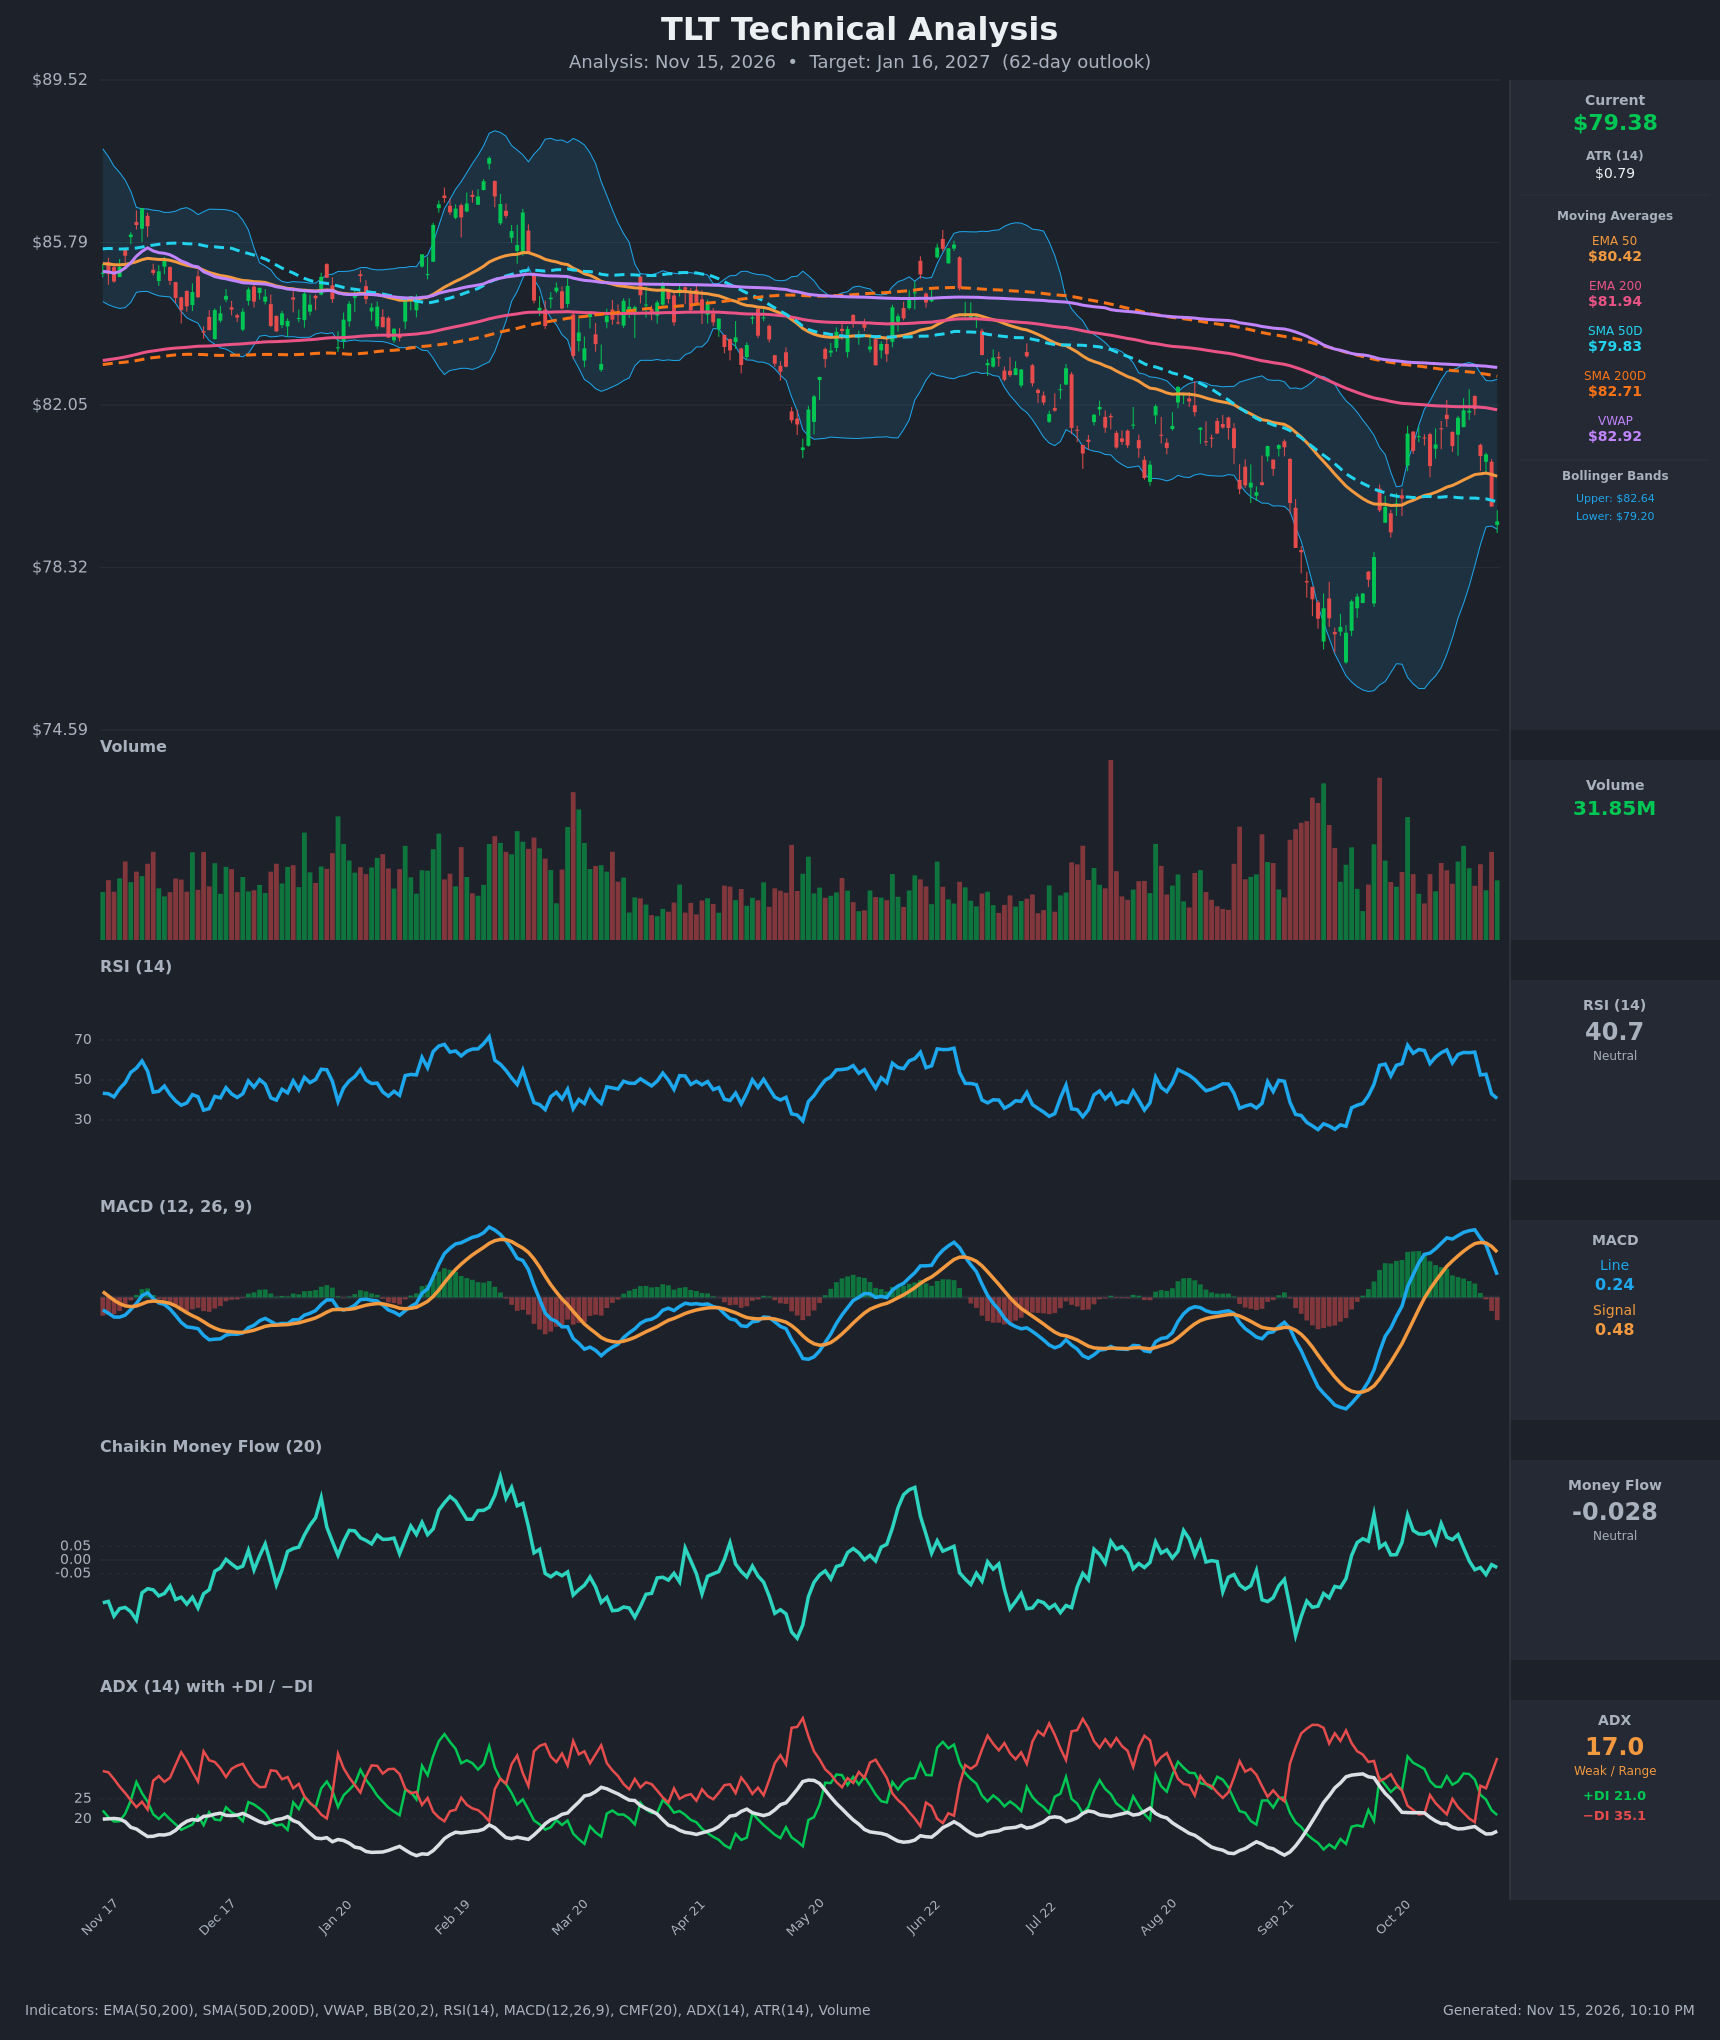
Analysis
TECHNICAL INDICATORS
- RSI (14): 40.75, down sharply from ~64 on Nov 9 and 52.5 on Nov 10. Momentum is rolling over and heading toward the 30-40 zone, but it is not yet oversold. [Bearish]
- 20 EMA: The chart does not show a 20 EMA, so I use the EMA 50 at $80.42 as a proxy. Price at $79.38 is below it, and the EMA 50 is now flattening and turning down. It is overhead resistance. The EMA 200 at $81.94 sits higher still. [Bearish]
- MACD: The line (0.238) crossed below the signal (0.477) on Nov 10. Both lines are falling and the histogram has turned negative (about -0.24), so momentum is deteriorating. The line is still above zero, so the larger move is a pullback within a recovery. [Bearish]
- Bollinger Bands (20): Upper is $82.64 and lower is $79.20. Price at $79.38 is hugging the lower band after a fall from the upper half. That shows strong near-term selling pressure, but it also raises the odds of a short-term bounce or a band walk. Bands are moderately wide. [Bearish]
- CMF (20): -0.028, down from +0.13 at the end of October. It has slipped into neutral, close to the -0.05 distribution threshold, and the trend is toward selling pressure. [Neutral]
- ADX (14): 17.0 with −DI (35.1) well above +DI (21.0). The trend is weak, but the DI spread has flipped decisively to the bears, and −DI crossed back above +DI on Nov 10. [Weak Trend + Bearish direction]
- Volume: 31.85M, near average, with no capitulation spike. The selloff on Nov 10 and Nov 12-13 came on solid but not extreme volume, which is consistent with orderly distribution. [Neutral to mildly bearish]
DIVERGENCES & TRENDS
- No clear divergence. Price is making lower lows within the last two sessions and RSI, MACD and DI all agree.
- The long-term structure is bearish. Price is below the SMA 200 ($82.71), EMA 200 ($81.94), EMA 50 ($80.42), SMA 50 ($79.83) and VWAP ($82.92).
- The SMA 50 ($79.83) is below the SMA 200 ($82.71), which is a standing death-cross configuration. The EMA 50 is also below the EMA 200.
- The October rally to ~$82 failed under the 200-period averages and VWAP. This is a classic lower-high rejection.
- The bearish MACD crossover from Nov 10 and the −DI takeover confirm the rollover.
- The September low near $76 is the major downside reference. The 50-day SMA at $79.83 has just been lost.
CHART PATTERNS
- Lower highs, lower lows: The multi-month structure is a descending channel since February. The October bounce to ~$82 was a lower high that failed at the 200-day averages.
- Possible Bearish Double Top / Rising Wedge variant: The Oct rebound (September low near $76 to ~$82) can be read as a rising-wedge-style relief rally that is now breaking down. The measured target is a retest of the September low area, around $76-77.
- Counterview: If price holds $77-79, a wide base (Bullish Double Bottom with the September low) could form. That needs a break above ~$82 to confirm, so it is not yet in play.
POTENTIAL SCENARIOS
- Scenario 1: Bearish Retest of September Lows — The failed rally and bearish MACD and DI readings push price back toward the prior low. Trigger: daily close below the lower Bollinger Band / $79.00, then below $78.30. Target: $76.50-$77.50. Invalidation: daily close above $81.00 (EMA 50 reclaim). (50% probability)
- Scenario 2: Neutral Range-Bound Chop — Weak ADX keeps price between about $77.50 and $81.50 with a bounce from the lower band. Trigger: stabilization above $78.30 with RSI turning up from 35-40. Target: $79.00-$80.50. Invalidation: close below $77.50 or above $82.00. (30% probability)
- Scenario 3: Bullish Reversal Above the 200s — Rates relief lifts price back through the moving averages. Trigger: close above $82.00 and the MACD recrossing up. Target: $83.00-$84.50. Invalidation: failure at $81.00. (20% probability)
PRICE TARGETS
For the 62-day horizon (about Jan 16, 2027):
- Target Price: $77.90 (about 1.9% below current)
- Expected Range: $72.60 to $82.60 (width $10.00, about 12.6% of current price, consistent with the 12-18% guidance for 30-60 days, and slightly wider here because the horizon is 62 days and ATR is $0.79)
- Key Levels: Support at $76.00, Resistance at $80.42
OVERALL BIAS
OVERALL BIAS: BEARISH - Price has rolled over from the 200-day averages with a bearish MACD crossover, a −DI takeover, an RSI drop from 64 to 41, and a break below the 50-day SMA. The most likely path is a drift back toward the $76-78 September low zone, though the weak ADX caps conviction.
This is educational analysis and not financial advice.