TLT 6-day bullish forecast — Nov 1, 2026
- Bias: Bullish
- Timeframe: 6 days (made Nov 1, 2026, target date Nov 6, 2026)
- Price at analysis: $81.84
- Price target: $82.35
- Expected range: $80.20 – $83.60
- Result: Correct (0.0%) — closed at $81.85 on Nov 6, 2026; quality score 100/100
Get a free AI analysis of TLT today
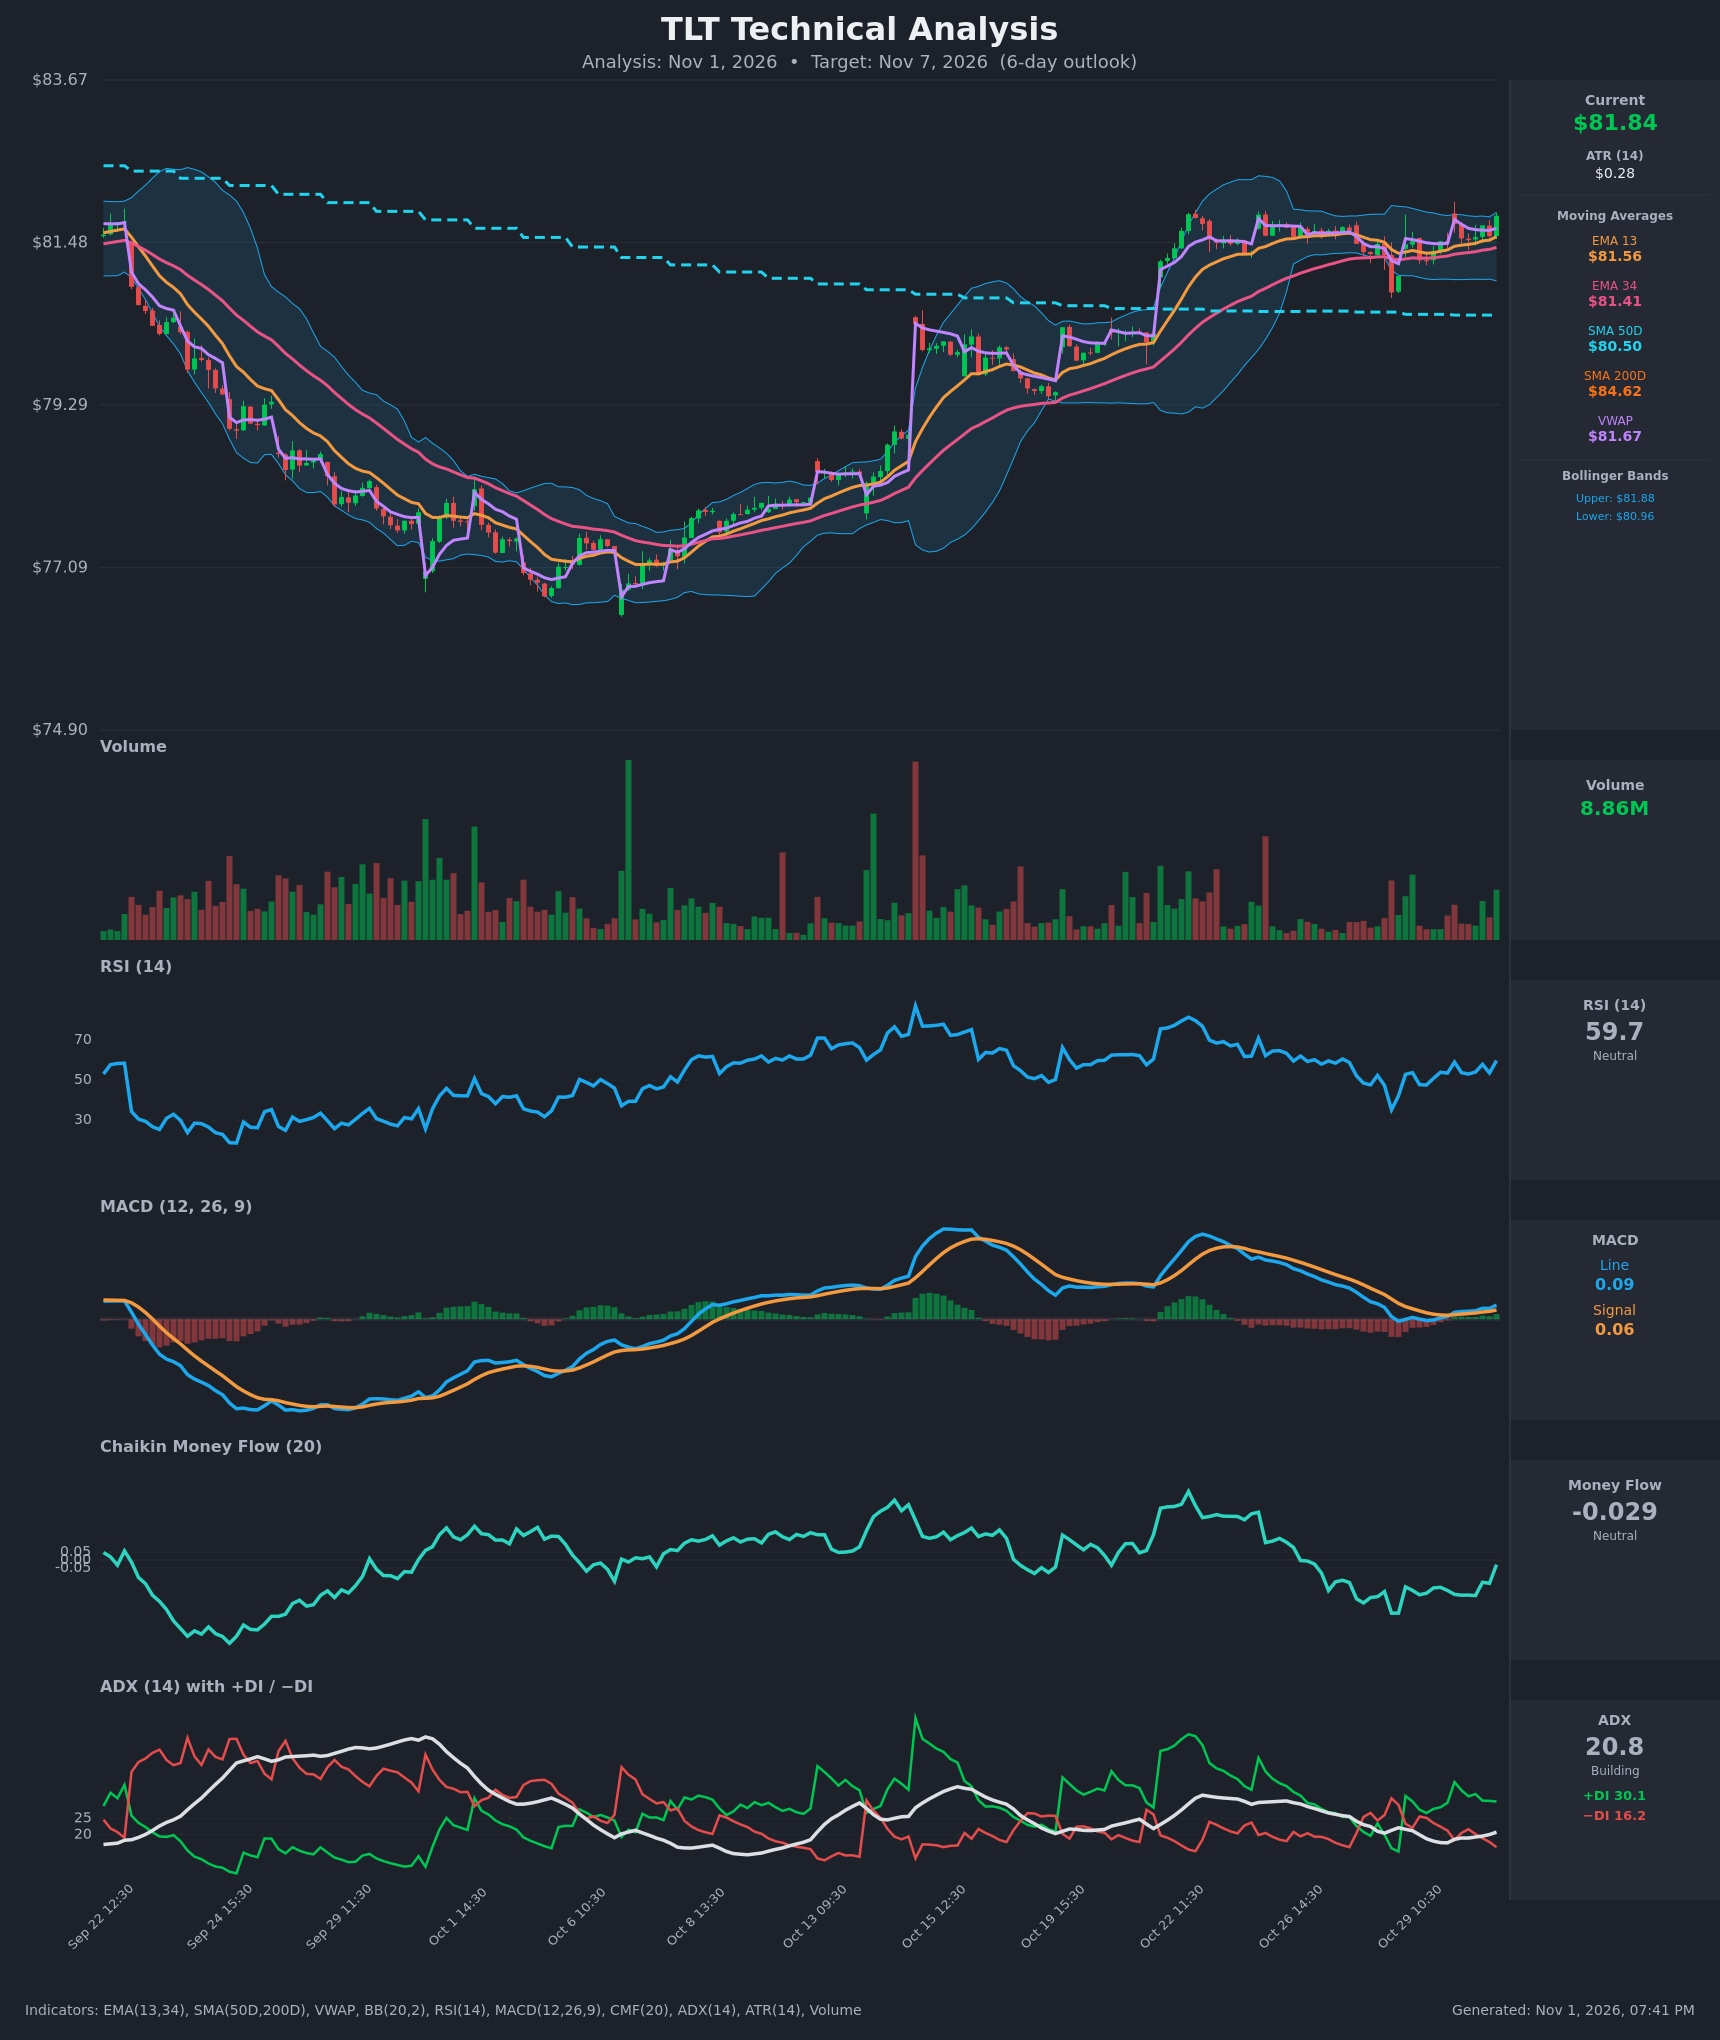
Analysis
TECHNICAL INDICATORS
- RSI (14): 59.70, up from 47.5 mid-session on Oct 29 and 53.5 an hour earlier. It is in the upper half of the neutral zone with room before 70, and the rising momentum is constructive. [Bullish]
- 20 EMA (EMA 13/34 used): EMA 13 is $81.56 and EMA 34 is $81.41. Price at $81.84 sits above both, and EMA 13 is above EMA 34 with a widening gap. Both should act as dynamic support on pullbacks. [Bullish]
- MACD: Line 0.089 is above Signal 0.058 and both are above zero. The line crossed back above the signal around Oct 29 15:30 and the histogram is positive and expanding. [Bullish]
- Bollinger Bands (20): Upper $81.88, lower $80.96, so price is pressing the upper band at $81.84. The bands are fairly narrow, which points to a low-volatility squeeze and a possible expansion. Upper-band tests in a mild uptrend can walk the band, but they can also mean-revert toward the mid-band (about $81.42). [Neutral]
- CMF (20): -0.029 is inside the ±0.05 neutral band. It has recovered sharply from -0.22 and is trending up, but there is no confirmed accumulation yet. [Neutral]
- ADX (14): 20.8 and rising from 17.5, with +DI 30.1 well above −DI 16.2. Bulls control direction, but the trend is not yet strong (<25), so a breakout is only starting to build. [Weak but Building Trend, Bullish]
- Volume: 8.86M is a green bar, in line with recent averages and well below the spikes seen on the Oct 15 and Oct 22 gap moves. The up-move is not yet backed by an expansion in participation. [Neutral to mildly Bullish]
DIVERGENCES & TRENDS
- There is no clear price/RSI or price/MACD divergence. RSI and MACD are making higher lows alongside price's higher lows over the last 2 days.
- The recent session has been a tight, choppy consolidation around $81.2–$81.8 after the rally from the ~$77 low, and the last bar broke up out of it.
- MACD's bullish re-cross above signal, the +DI/−DI spread (30.1 vs 16.2) and price above VWAP ($81.67) all confirm buyers are in control short-term.
- CMF remains below zero while price has made higher highs. This is a mild caution that volume flow has not confirmed the move.
- Price is above the SMA50D ($80.50, rising), but it is still well below the SMA200D ($84.62), which is declining. The long-term trend is still down, and a death cross is already in place. The SMA200D is a distant overhead cap and any rally faces major resistance there.
CHART PATTERNS
- The best fit is a Bullish Flag / Ascending Triangle-style consolidation under the ~$82.20–$82.40 highs. It follows the strong impulse from $77 to $82.4, and higher lows have been forming against flat resistance.
- A close above ~$82.40 would project a measured move of roughly $83.5–$84, toward the declining SMA200D.
- The earlier V-shaped recovery from $77 resembles a large bullish reversal, but the SMA200D overhead limits conviction. A failure of the range would shift the pattern into a range-bound or rounded-top structure.
POTENTIAL SCENARIOS
- Scenario 1: Bullish Breakout Above Consolidation — Price holds above the EMAs and breaks the ~$82.40 highs, aided by MACD and DI strength and ADX rising above 25. Trigger: close above $82.40 on rising volume. Target: $83.20–$83.60. Invalidation: close back below $81.40 (EMA 34). (50% probability)
- Scenario 2: Neutral Range Chop — The squeeze persists and price oscillates between the EMAs and the upper band. Trigger: ADX stalls near 20 and price rejects $82.2. Target: $81.40–$82.20. Invalidation: a decisive break of either $80.90 or $82.40. (30% probability)
- Scenario 3: Bearish Pullback — The upper-band rejection leads to mean reversion and a loss of the EMAs, with CMF turning negative again. Trigger: close below $81.40 and the lower band. Target: $80.50–$80.90 (SMA50D and lower band). Invalidation: reclaim of $82.00. (20% probability)
PRICE TARGETS
- Target Price: $82.35 (6-day)
- Expected Range: $80.20 to $83.60 (width $3.40, about 4.2% of current price, scaled for a 6-day horizon)
- Key Levels: Support at $81.41, Resistance at $82.40
OVERALL BIAS
OVERALL BIAS: BULLISH - MACD has re-crossed bullish, price is above its EMAs and VWAP, +DI dominates −DI with ADX building, and RSI is rising with room to run. Caution is warranted because CMF is still neutral, price is at the upper band, and the SMA200D caps the longer-term upside.
This is educational analysis and not financial advice.