TLT 13-day bullish forecast — Nov 1, 2026
- Bias: Bullish
- Timeframe: 13 days (made Nov 1, 2026, target date Nov 13, 2026)
- Price at analysis: $81.84
- Price target: $82.50
- Expected range: $78.90 – $85.40
- Result: Incorrect (-3.0%) — closed at $79.42 on Nov 13, 2026; quality score 49/100
Get a free AI analysis of TLT today
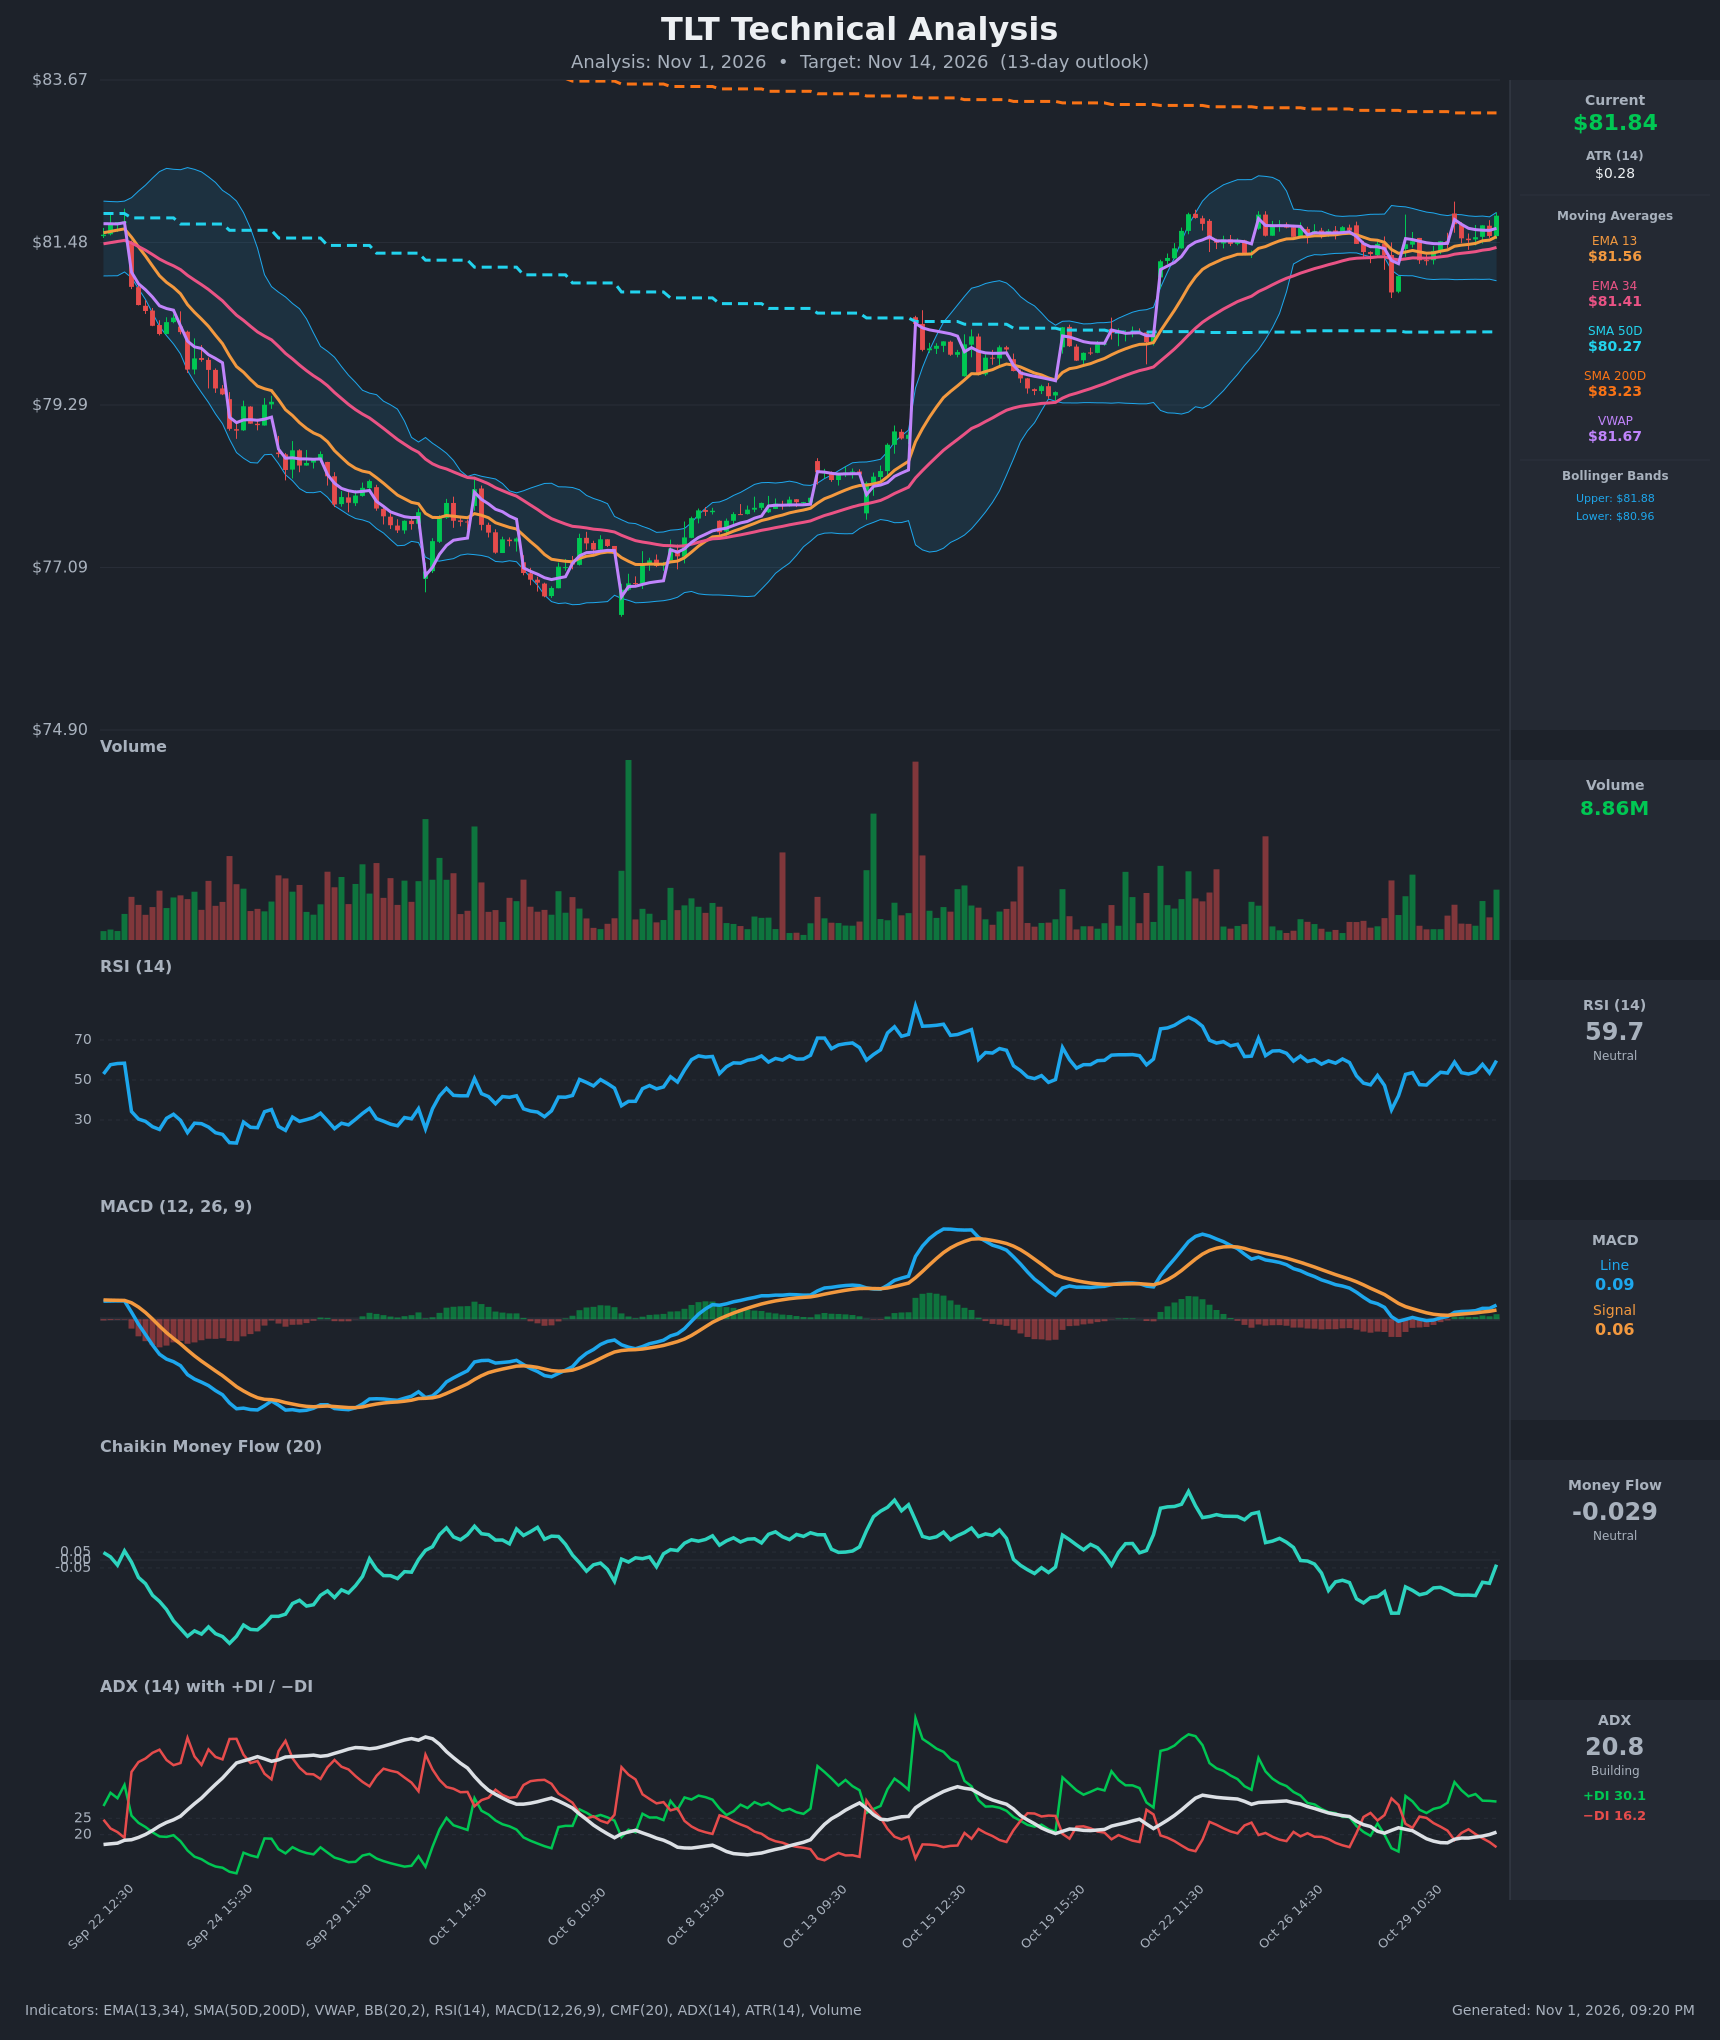
Analysis
TECHNICAL INDICATORS
- RSI (14): 59.7, up from the 47–54 area earlier in the week and climbing toward the upper half of its range. It is well below the 70 overbought line, so there is room to run. [Bullish]
- 20 EMA: The chart shows EMA 13 at $81.56 and EMA 34 at $81.41. Price at $81.84 is above both, and EMA 13 is above EMA 34, so the short-term trend is up. Both EMAs are rising gently and should act as support near $81.40–$81.56. [Bullish]
- MACD: The line at 0.089 is above the signal at 0.058. It crossed up from below around Oct 29 and the histogram is slightly positive and widening. Both lines are still near zero, so this is early momentum rather than a strong trend. [Bullish]
- Bollinger Bands (20): Upper band $81.88, lower $80.96, middle about $81.42. Price at $81.84 sits near the upper band. The bands are narrow, so volatility is compressed, and the band width is only about $0.92, or 1.1% of price. A close at the upper band in a squeeze can precede a breakout, but it also means mean-reversion risk back toward the midline. [Neutral]
- CMF (20): -0.029, inside the ±0.05 neutral zone. It has recovered sharply from -0.22 and is turning up, but it has not yet confirmed accumulation. [Neutral]
- ADX (14): 20.8 and rising slightly from 17.5. +DI at 30.1 is well above −DI at 16.2, so bulls are in control. The trend is still weak to borderline, just under the 25 threshold. [Weak Trend, Bullish direction]
- Volume: 8.86M, an average to slightly below-average bar on the latest up move. There is no strong volume surge behind the breakout attempt, so conviction is modest. [Neutral to mildly Bullish]
DIVERGENCES & TRENDS
- There is no clear divergence. RSI, MACD and price are all making higher short-term readings together.
- CMF is lagging price. It is still slightly negative while price is near highs of the recent range, which is a mild warning that buying pressure is not fully confirmed.
- The EMA 13 / EMA 34 cross is already established to the upside, and the gap is widening slowly.
- MACD crossed above its signal on Oct 29–30, and +DI has held above −DI since Oct 29.
- The VWAP at $81.67 is below price, which shows intraday buyers are in control.
- Price is above SMA50D ($80.27), which is rising and acts as a floor. It is still below SMA200D ($83.23), so the long-term trend is not yet repaired.
- SMA50D remains below SMA200D, so no golden cross is in place. This is a longer-term overhead cap.
- Price has recovered from the late-Oct low near $77 to an $81–$82 range. It has been consolidating just under $82 for about two weeks, forming a basing structure.
CHART PATTERNS
- Ascending triangle / bullish consolidation (loosely): Price has repeatedly tested resistance around $81.9–$82.2 while making slightly higher lows near $80.9–$81.4. A close above about $82.2 would confirm a breakout. The measured move is roughly the height of the base, about $1.2–$1.5, which points to $83.2–$83.5. That target coincides with the SMA200D.
- Bullish pennant / flag after the sharp Oct 22 rally: The tight consolidation after the sharp advance is consistent with a continuation pattern. The same $83+ area is the target.
- The pattern is imperfect and ADX is below 25, so the breakout is not guaranteed. A failure below $80.9 would turn the structure into a range.
POTENTIAL SCENARIOS
- Scenario 1: Bullish Breakout Toward the SMA200D — Price breaks above the range top and the upper band, with MACD and +DI continuing to build. Trigger: close above $82.20. Target: $83.00–$83.30, where the SMA200D acts as resistance. Invalidation: close below $81.40 (EMA 34 and the band midline). (50% probability)
- Scenario 2: Neutral Range Consolidation — Price chops between the EMAs and the upper band as ADX stays near 20. Trigger: failure to close above $82.20 with no break below $81.00. Target: $81.30–$82.10. Invalidation: a close outside $80.90–$82.40. (30% probability)
- Scenario 3: Bearish Rejection — The upper-band test fails, CMF turns negative again, and price slides back to the lower band and SMA50D. Trigger: close below $81.00. Target: $80.30–$80.60. Invalidation: reclaim of $81.90. (20% probability)
PRICE TARGETS
For a 13-day horizon, the range should be about 8–12% of price, so about $6.5–$9.8 wide by the guide. TLT's actual volatility is lower (ATR $0.28, about 0.35% per bar), so I use the lower end of the guided width. The estimated 13-day volatility is about 1.5–2.5%, and I widen the range somewhat for the sake of the guide.
- Target Price: $82.50 (modestly above the current price, in line with the bullish pattern and momentum)
- Expected Range: $78.90 to $85.40. The width is $6.50, or about 7.9% of current price, which is at the low edge of the 14–21 day guidance and appropriate given TLT's low volatility.
- Key Levels: Support at $81.41 (EMA 34), with deeper support at $80.27 (SMA50D). Resistance at $83.23 (SMA200D), with minor resistance at $82.20.
OVERALL BIAS
OVERALL BIAS: BULLISH - Price is above all short-term moving averages and VWAP, MACD has crossed up, +DI dominates −DI, and RSI is rising with room before overbought. Upside is likely limited by the SMA200D near $83.23, and weak ADX and neutral CMF keep conviction modest.
This is educational analysis and not financial advice.