XLE 13-day bullish forecast — Nov 1, 2026
- Bias: Bullish
- Timeframe: 13 days (made Nov 1, 2026, target date Nov 13, 2026)
- Price at analysis: $70.00
- Price target: $70.90
- Expected range: $67.30 – $72.90
- Result: Incorrect (-7.2%) — closed at $64.96 on Nov 13, 2026; quality score 11/100
Get a free AI analysis of XLE today
Analysis
TECHNICAL INDICATORS
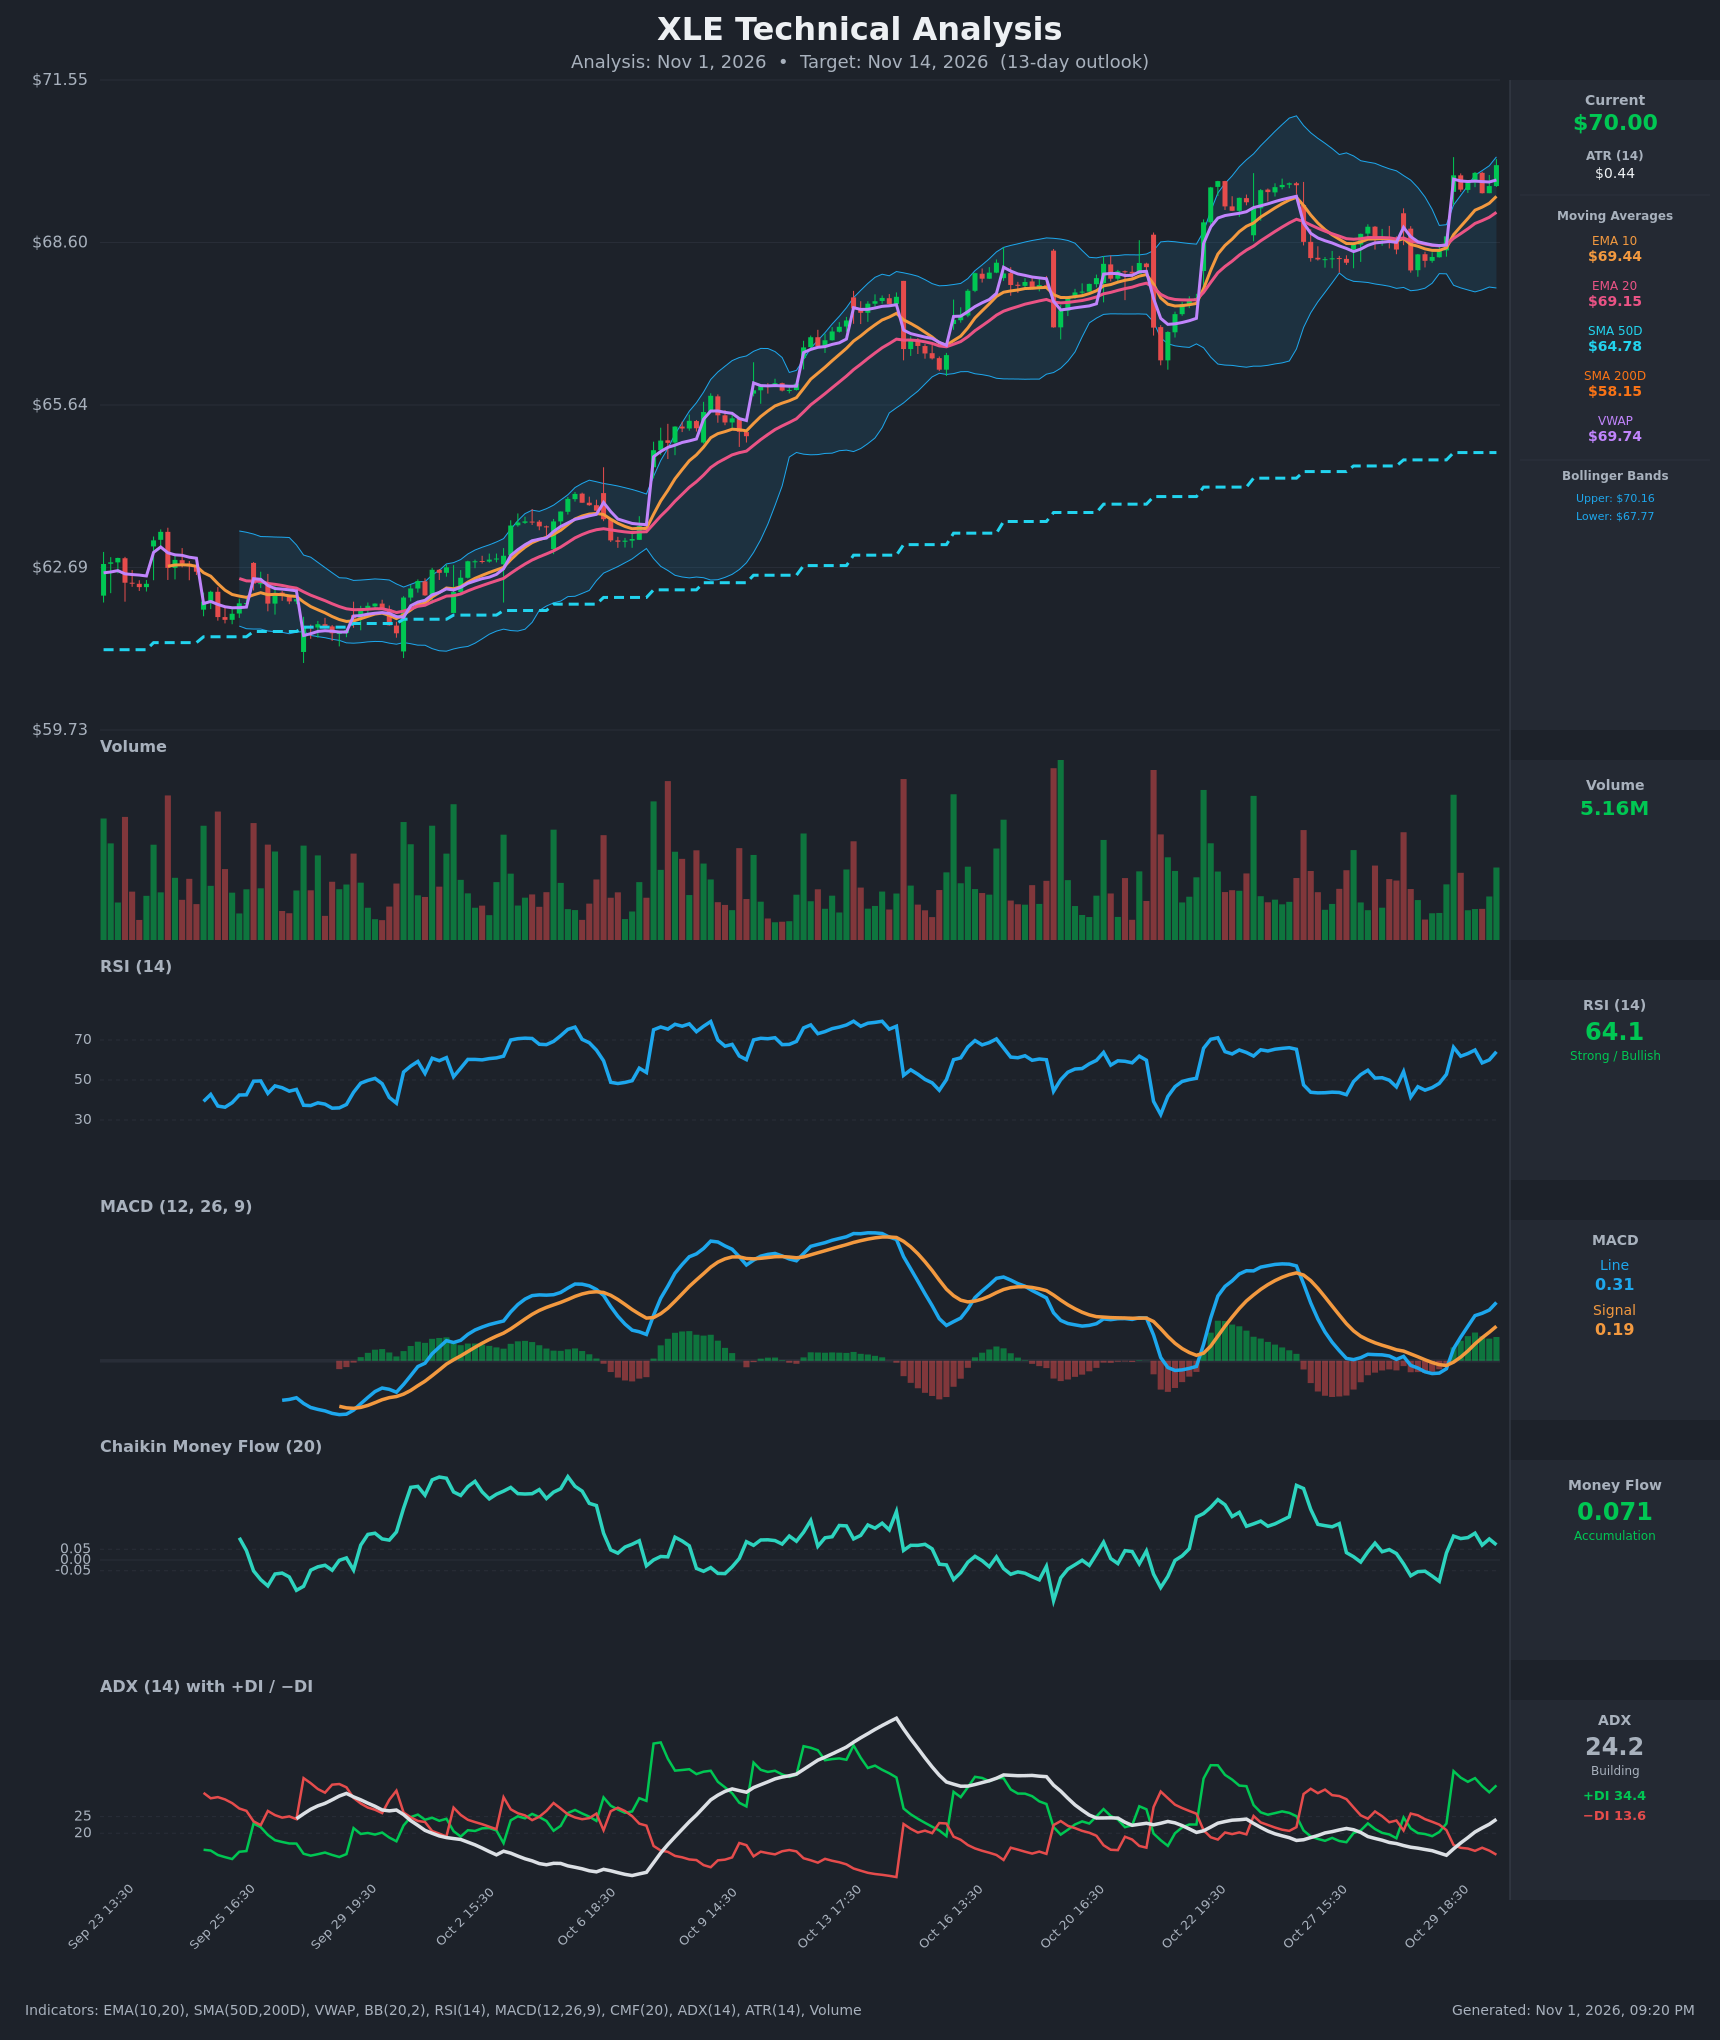
- RSI (14): 64.13, up from the 42-47 area on Oct 29 and peaking at 66.4 on the Oct 30 gap up. It is in bullish territory but below 70, so there is still room before overbought. Momentum is rising. [Bullish]
- 20 EMA: $69.15, with price ($70.00) above it. EMA10 ($69.44) is above EMA20 and both are rising, so the short-term trend is up. The 20 EMA is the first dynamic support. [Bullish]
- MACD: Line 0.3135 is above the signal at 0.1856. It crossed up from -0.043 vs -0.025 on Oct 29 to +0.065 vs -0.007 on Oct 30, and the histogram is positive and expanding. The line is back above zero. [Bullish]
- Bollinger Bands (20): Upper $70.16, lower $67.77, so price is hugging the upper band. The bands are fairly wide and starting to expand after the earlier squeeze. This shows strength, though a short-term pause or pullback toward the midline (about $68.96) is possible. [Bullish]
- CMF (20): 0.071, just above the +0.05 threshold. It has been mostly positive since the Oct 30 breakout, which signals mild accumulation but not strong buying pressure. [Accumulation]
- ADX (14): 24.2 and rising from about 13 on Oct 29, just under the 25 trend threshold. +DI (34.4) is far above −DI (13.6), so bulls are firmly in control. A move above 25 would confirm a trend. [Strong Trend building – Bullish]
- Volume: 5.16M, roughly average. The gap-up bars on Oct 30 were backed by above-average green volume, with no sign of distribution. Breakout confirmation is decent but not explosive. [Moderately supportive of uptrend]
DIVERGENCES & TRENDS
- There are no bearish divergences. RSI (64) is below its earlier peaks of 75+ while price is making new highs, but that is just room to run, not a divergence.
- Price is far above the SMA50 ($64.78) and SMA200 ($58.15). The golden cross is already in place, and both averages are rising, so the long-term trend is firmly up.
- The MACD bullish crossover came right as price gapped up from the $68-69 consolidation. VWAP ($69.74) is also below price, which is supportive.
- The DI spread widened sharply on Oct 30 (+DI jumped from 22.9 to 38.6) and ADX is climbing. This is trend-initiation behavior.
- Price is trading about 7.9% above the SMA50, so it is somewhat stretched in the near term. A pullback to the EMAs would be healthy.
CHART PATTERNS
- Bullish Flag / rectangle consolidation (breakout): After the rally to about $69.5, price consolidated between $68.0 and $69.0 from Oct 24-29. The Oct 30 gap up resolved the range to the upside, matching the continuation breakouts in the reference diagram. A measured move from the pole (roughly $66.2 to $69.5, about $3.3) would imply the mid-$70s on a longer horizon. A 13-day target is more conservative, near $71-72, because price is pressing the upper Bollinger Band and prior highs.
- Overall structure is a staircase uptrend of higher highs and higher lows, with each consolidation holding above the 20 EMA.
POTENTIAL SCENARIOS
- Scenario 1: Bullish Breakout Continuation — Price holds above the $69.15-69.45 EMA zone and extends the uptrend as ADX crosses above 25 and MACD widens. Trigger: Close above $70.30 on solid volume. Target: $71.00-$72.00. Invalidation: Close below $68.40, which would put price back in the old range. (55% probability)
- Scenario 2: Neutral Consolidation Below Highs — Price stalls at the upper Bollinger Band and chops between $69.00 and $70.50 while indicators cool off. Trigger: Failure to close above $70.30 and ADX stalling under 25. Target: $69.00-$70.50. Invalidation: A decisive break above $71.00 or below $68.40. (20% probability)
- Scenario 3: Bearish Pullback / Failed Breakout — The gap fills and price retests the range as the upper band rejects it. Trigger: Close below the 20 EMA ($69.15) and VWAP, with CMF dropping below zero. Target: $67.80-$68.40 (lower BB and prior range lows). Invalidation: Recovery above $70.30. (25% probability)
PRICE TARGETS
- Target Price: $70.90 (13-day horizon, Nov 14)
- Expected Range: $67.30 to $72.90 (width $5.60, about 8.0% of the current price, scaled for 13 days)
- Key Levels: Support at $69.15 (20 EMA, then $68.40 range lows), Resistance at $71.00 (upper-band zone and next extension)
OVERALL BIAS
OVERALL BIAS: BULLISH - Price is above all key moving averages with a fresh MACD bullish crossover. +DI is far above −DI with ADX rising toward 25, and CMF shows mild accumulation. A bullish-flag breakout points to $71-72, though proximity to the upper Bollinger Band may bring a short-term pullback toward the 20 EMA first.
This is educational analysis and not financial advice.