BAC 13-day bearish forecast — Nov 1, 2026
- Bias: Bearish
- Timeframe: 13 days (made Nov 1, 2026, target date Nov 13, 2026)
- Price at analysis: $50.00
- Price target: $49.20
- Expected range: $47.90 – $51.90
- Result: Incorrect (+1.7%) — closed at $50.87 on Nov 13, 2026; quality score 50/100
Get a free AI analysis of BAC today
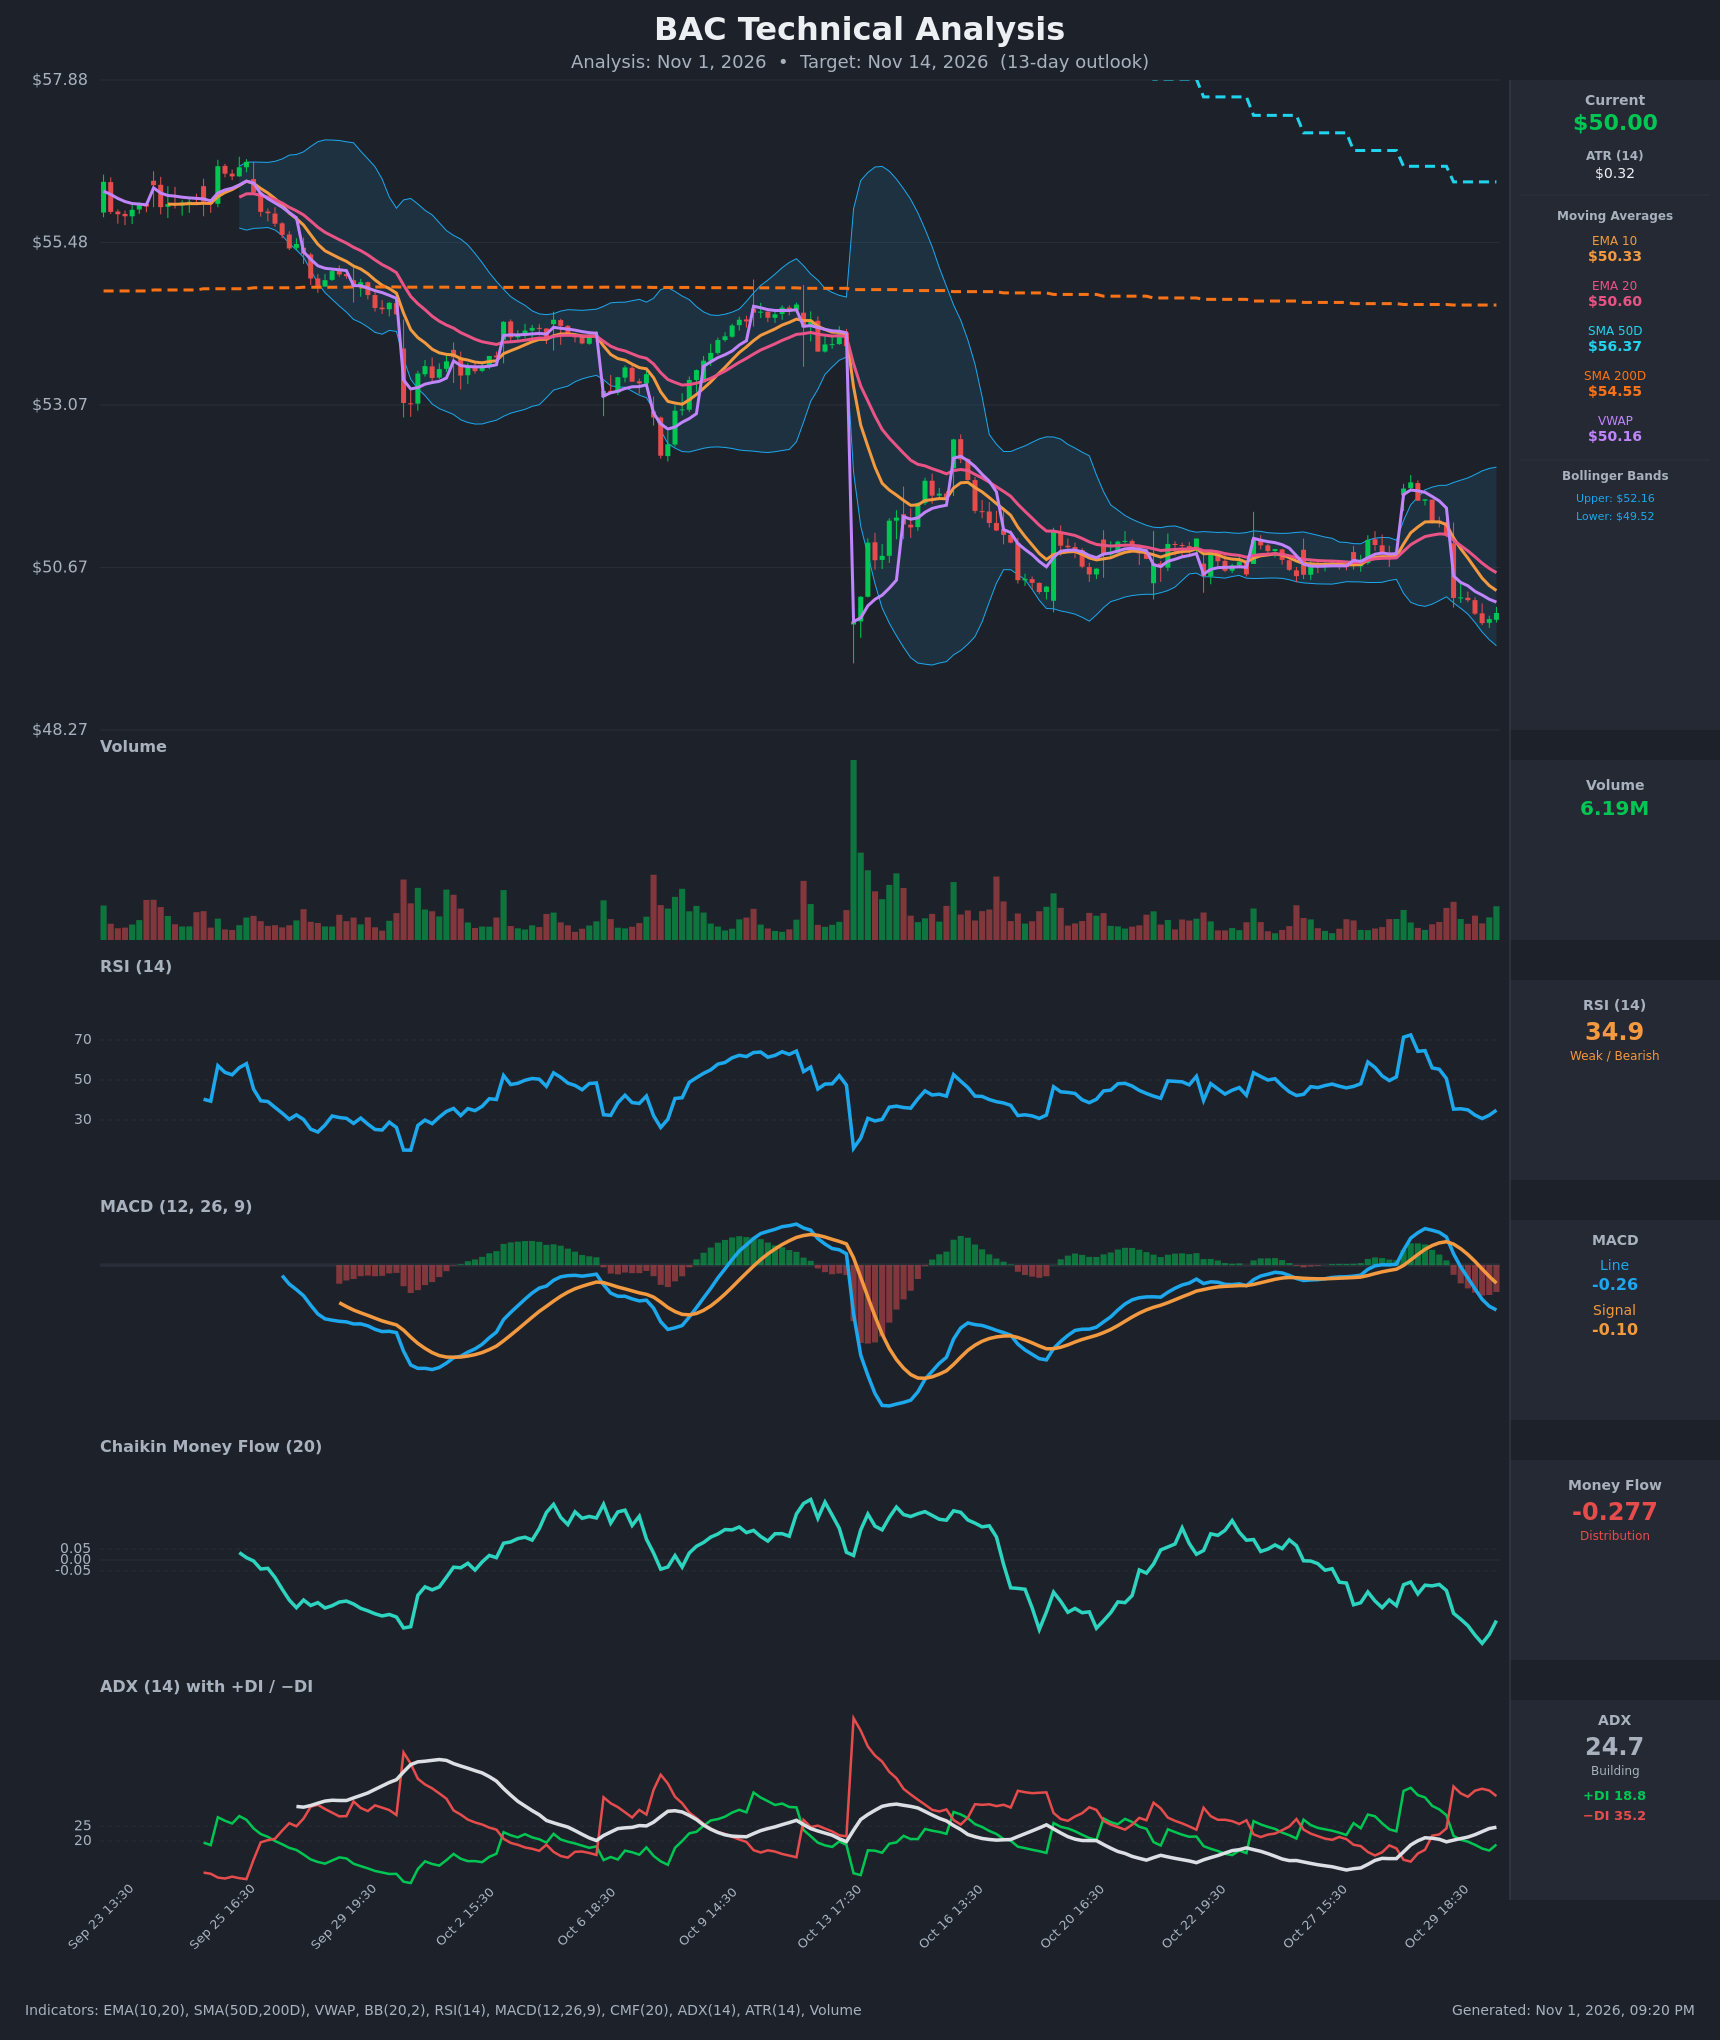
Analysis
TECHNICAL INDICATORS
- RSI (14): 34.91, just off a low of ~30.7 on Oct 30 and still in weak territory below 50. It fell from 72 on Oct 29 to the low 30s within a day. It is not yet oversold, so a small bounce is possible without a trend change. [Bearish]
- 20 EMA: $50.60, with EMA10 at $50.33 below it. Price at $50.00 is below both, so they act as resistance. EMA10 crossed under EMA20 around Oct 30 15:30, a fresh bearish crossover. [Bearish]
- MACD: Line -0.257 is below signal -0.103, with a widening negative histogram. The bearish crossover occurred around Oct 30 14:30, and the line is still falling away from the signal. [Bearish]
- Bollinger Bands (20): Upper $52.16, lower $49.52. Price at $50.00 sits in the lower quarter of the bands after a sharp downside move out of a tight squeeze. The bands are starting to expand downward, and a tag of the lower band is plausible. [Bearish]
- CMF (20): -0.277, deep in distribution and well below -0.05. It has fallen steadily from near zero, so sellers dominate volume. The latest uptick from -0.382 is minor. [Distribution]
- ADX (14): 24.7 and rising, close to the 25 trend threshold. −DI (35.2) is far above +DI (18.8), with −DI on top since Oct 30. This is a developing bearish trend. [Strong Trend – Bearish]
- Volume: 6.19M, average to slightly elevated on the recent red bars. There is no capitulation spike like the Oct 13 gap, so the selling is steady rather than exhausted. [Mild bearish confirmation]
DIVERGENCES & TRENDS
- No clear bullish divergence yet. RSI at 34.9 is above its prior lows (~25–30) while price is near its recent lows, but this is not a clean divergence.
- Price is below the SMA200D ($54.55) and SMA50D ($56.37), both far overhead. The SMA50D is still above the SMA200D, so there is no death cross, but the gap is narrowing. The long-term trend is damaged.
- Price lost the VWAP ($50.16) and all short EMAs together. MACD and DI crossovers all turned bearish on Oct 30.
- The multi-week range of $50.30–$51.50 has broken to the downside, and the prior bounce failed at the 72 RSI peak.
- ADX is climbing toward 25 while −DI dominates, so trend strength is building on the downside.
CHART PATTERNS
- Rectangle/consolidation breakdown (closest reference: Bearish Triple Top / Bearish Flag-style continuation): Price spent weeks in a tight $50.30–$51.50 range after the Oct 13 gap-down, then broke below it. This resembles a bearish continuation after a drop. The measured move (range height ~$1.2) projects toward ~$49.0.
- Lower highs: The Oct 29 high (~$52) was well below earlier peaks, which fits a bearish structure.
- No confirmed reversal pattern (double bottom, inverted H&S) is visible. A bounce toward $50.60–$51.00 would likely be a retest of the broken range.
POTENTIAL SCENARIOS
- Scenario 1: Bearish Continuation Lower — Price stays below the EMAs and VWAP, with MACD, DI and CMF all bearish. Sellers push price to test the lower Bollinger Band and the Oct 13 low area. Trigger: failure to reclaim $50.60 and a break below $49.80. Target: $49.20, with an extension to $48.50. Invalidation: daily close above $50.95. (55% probability)
- Scenario 2: Bullish Relief Bounce — RSI near 30 and the lower band trigger a mean-reversion bounce back to the EMA20 and the top of the old range. Trigger: hold of $49.50 and reclaim of $50.60. Target: $51.20–$51.50. Invalidation: close below $49.30. (30% probability)
- Scenario 3: Neutral Choppy Range — Price oscillates between $49.40 and $50.80 as ADX stalls under 25. Trigger: ADX rolling over and MACD flattening. Target: $50.00. Invalidation: break outside $49.30–$51.00. (15% probability)
PRICE TARGETS
- Target Price: $49.20 (13-day horizon)
- Expected Range: $47.90 to $51.90 (width $4.00, about 8% of current price, in line with the 7–21 day guidance)
- Key Levels: Support at $49.30, Resistance at $50.60
OVERALL BIAS
OVERALL BIAS: BEARISH - Price is below all key moving averages and VWAP, with a bearish MACD crossover, −DI far above +DI with ADX rising, and deep CMF distribution after a range breakdown. RSI near 35 raises the chance of a short bounce, but the evidence favors a drift toward ~$49.
This is educational analysis and not financial advice.