TQQQ 13-day bullish forecast — Nov 1, 2026
- Bias: Bullish
- Timeframe: 13 days (made Nov 1, 2026, target date Nov 13, 2026)
- Price at analysis: $62.02
- Price target: $63.70
- Expected range: $59.50 – $66.00
- Result: Incorrect (-7.0%) — closed at $57.68 on Nov 13, 2026; quality score 10/100
Get a free AI analysis of TQQQ today
Analysis
TECHNICAL INDICATORS
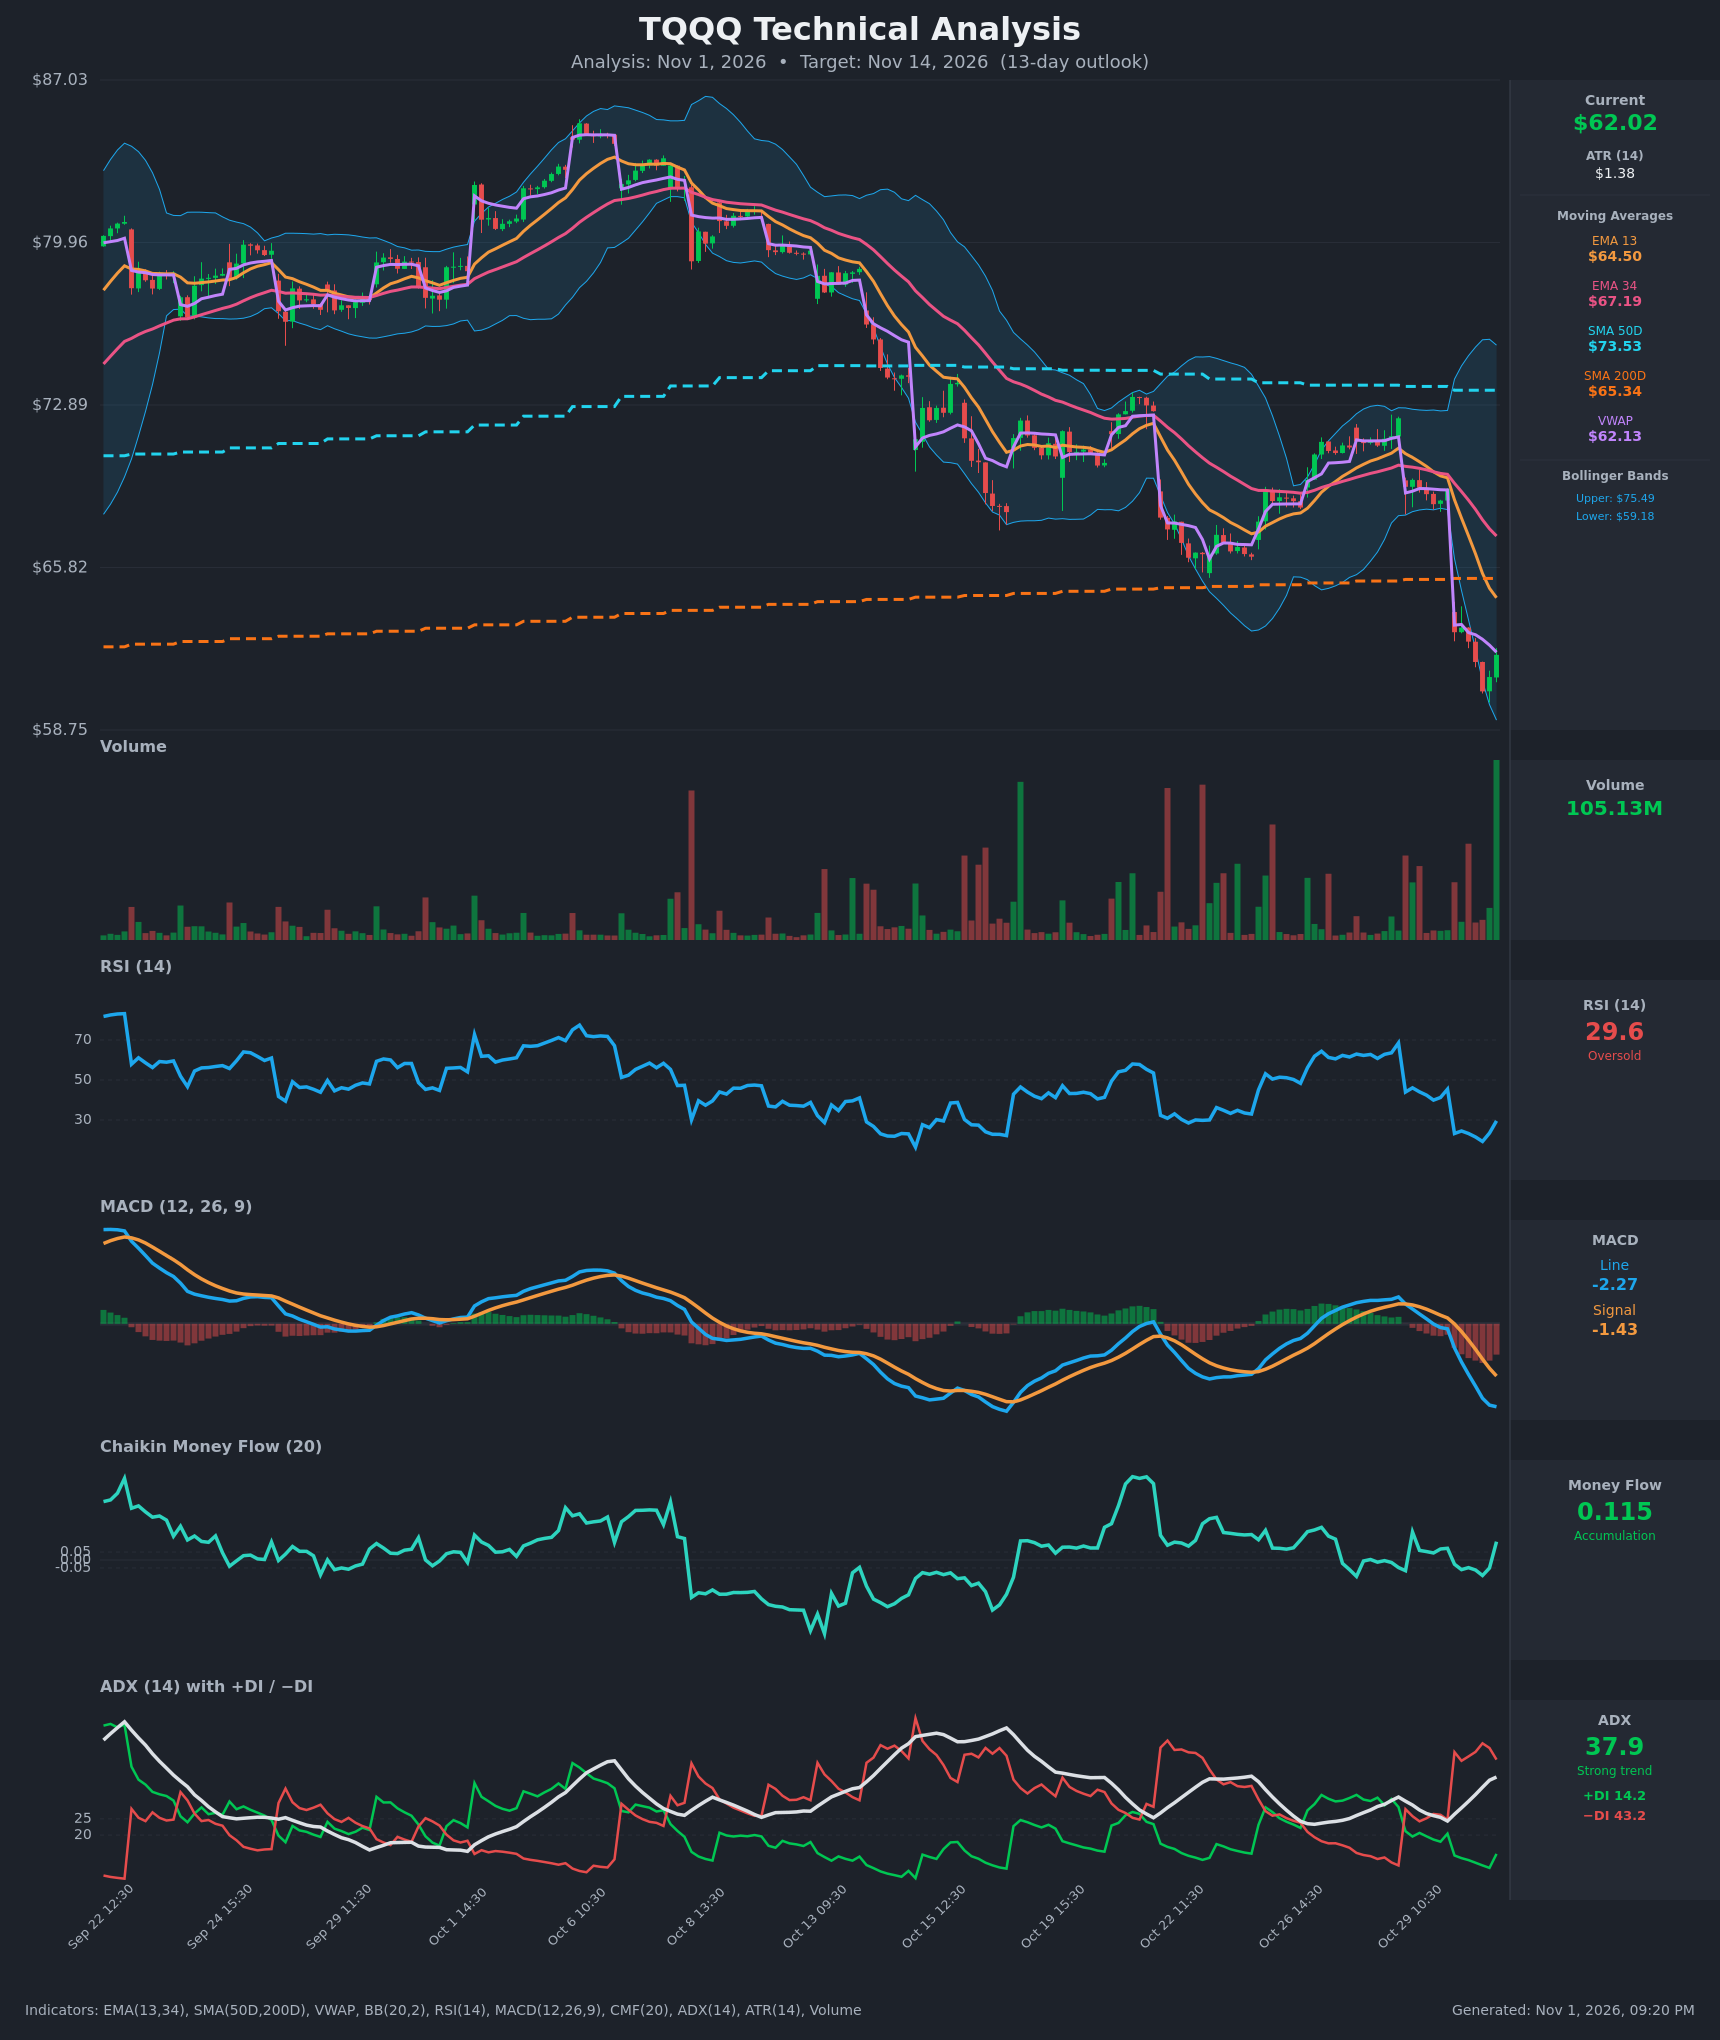
- RSI (14): 29.56, just back above 30 after a low near 19.3 on the Oct 30 13:30 bar. It is oversold but turning up sharply (19.3 → 23.5 → 29.6), the first sign of downside exhaustion. [Bullish]
- 20 EMA: Not supplied. The EMA 13 is $64.50 and the EMA 34 is $67.19, both above price at $62.02, so they act as stacked overhead resistance. EMA13 crossed below EMA34 on Oct 29 13:30, and the gap is widening. [Bearish]
- MACD: Line -2.27 is below signal -1.43, a bearish cross that happened around Oct 29 15:30–Oct 30. The histogram is deeply negative and still expanding, so downside momentum has not yet rolled over. [Bearish]
- Bollinger Bands (20): Price is $62.02 against a lower band of $59.18, middle near $67.3 and upper of $75.49. The bands are wide after the gap down. Price touched or pierced the lower band and closed back inside it, which is a short-term oversold stretch that often mean-reverts toward the middle band. [Neutral]
- CMF (20): +0.115, up from -0.097 and back in accumulation territory. The last bar closed near its high on very heavy volume, suggesting dip buying. [Accumulation]
- ADX (14): 37.9 and rising, with −DI (43.2) far above +DI (14.2). This is a strong established downtrend, though +DI ticked up from 9.9 to 14.2 on the final bar. [Strong Trend – Bearish]
- Volume: 105.13M on the last bar is the largest in the visible window and was a green candle off the lows. This looks like a capitulation or absorption bar, though it needs follow-through. [Potential capitulation / Bullish tilt]
DIVERGENCES & TRENDS
- There is no clean bullish RSI divergence. RSI made a lower low on the latest leg (19.3), and price made a new low at $60.43, so the two confirm each other. RSI is now curling up while price holds above the low.
- The long-term structure is bearish. Price has lower highs from ~$85 → $73 → $72 and is below the EMA13, EMA34 and SMA50D ($73.53).
- Price just broke below the SMA200D ($65.34), the first loss of long-term support in this window. The SMA50D remains above the SMA200D, so there is no death cross yet, but they are converging.
- The gap down from $69.2 to $63.0 on Oct 30 09:30 was a sharp, sudden break out of a tight consolidation.
- CMF has flipped from negative to positive in the last bar, while MACD and ADX are still bearish. This is early evidence of a counter-trend bounce.
- Price ($62.02) sits almost exactly at VWAP ($62.13), so the intraday buyer/seller balance is even.
CHART PATTERNS
- Bearish Flag / Pennant (continuation): The Oct 26–29 sideways drift near $69–72 after a drop from $85 resolved with a gap down. This matches the Bearish Flag/Pennant in the reference diagram. A measured-move target well below, in the mid-$50s, remains a risk.
- Counter-trend relief setup: The close back above the lower Bollinger Band on huge volume suggests a short-term bounce. The likely upside zone is the EMA13 at $64.50 and the SMA200D at $65.34, both of which should act as resistance.
- There is no confirmed reversal pattern (no double bottom or inverted head and shoulders), so any bounce is a countertrend rally within a downtrend.
POTENTIAL SCENARIOS
- Scenario 1: Bullish Oversold Relief Bounce — Capitulation volume, RSI exiting oversold and CMF turning positive trigger a mean-reversion rally toward the declining EMAs. Trigger: hold above $60.40 and close above $63.00–$63.50. Target: $64.50 (EMA13), then $65.30 (SMA200D). Invalidation: close below $60.40. (48% probability)
- Scenario 2: Bearish Trend Continuation — The ADX/−DI dominance and bear-flag breakdown keep pushing price lower, with rallies sold at the EMA13. Trigger: failure at $63.50–$64.50, or a break below $60.40. Target: $58.50–$57.00 (below the lower Bollinger Band). Invalidation: close above $65.40 (SMA200D). (37% probability)
- Scenario 3: Neutral Basing Chop — Price consolidates between the lower band and EMA13 while the indicators reset. Trigger: inside-day range between $60.50 and $64.00. Target: $61.50–$63.00. Invalidation: a decisive close outside $60.40–$64.50. (15% probability)
PRICE TARGETS
- Target Price: $63.70 (13-day)
- Expected Range: $59.50 to $66.00. Width is $6.50, about 10.5% of the current price, which fits the 13-day guidance.
- Key Levels: Support at $60.40 (recent low; Bollinger lower band $59.18 below it), Resistance at $64.50 (EMA13; then SMA200D at $65.34)
OVERALL BIAS
OVERALL BIAS: BULLISH - Price is oversold (RSI recovering from 19 to 29.6), closed back inside the lower Bollinger Band on record volume, and CMF has flipped positive, favoring a relief bounce toward $64–65. The broader trend (ADX 37.9, −DI dominant, MACD falling) is bearish, so conviction is modest and the rally likely stalls at the EMA13/SMA200D.
This is educational analysis and not financial advice.