WMT 13-day bullish forecast — Nov 1, 2026
- Bias: Bullish
- Timeframe: 13 days (made Nov 1, 2026, target date Nov 13, 2026)
- Price at analysis: $123.52
- Price target: $125.00
- Expected range: $119.00 – $128.50
- Result: Correct (+3.7%) — closed at $128.09 on Nov 13, 2026; quality score 100/100
Get a free AI analysis of WMT today
Analysis
TECHNICAL INDICATORS
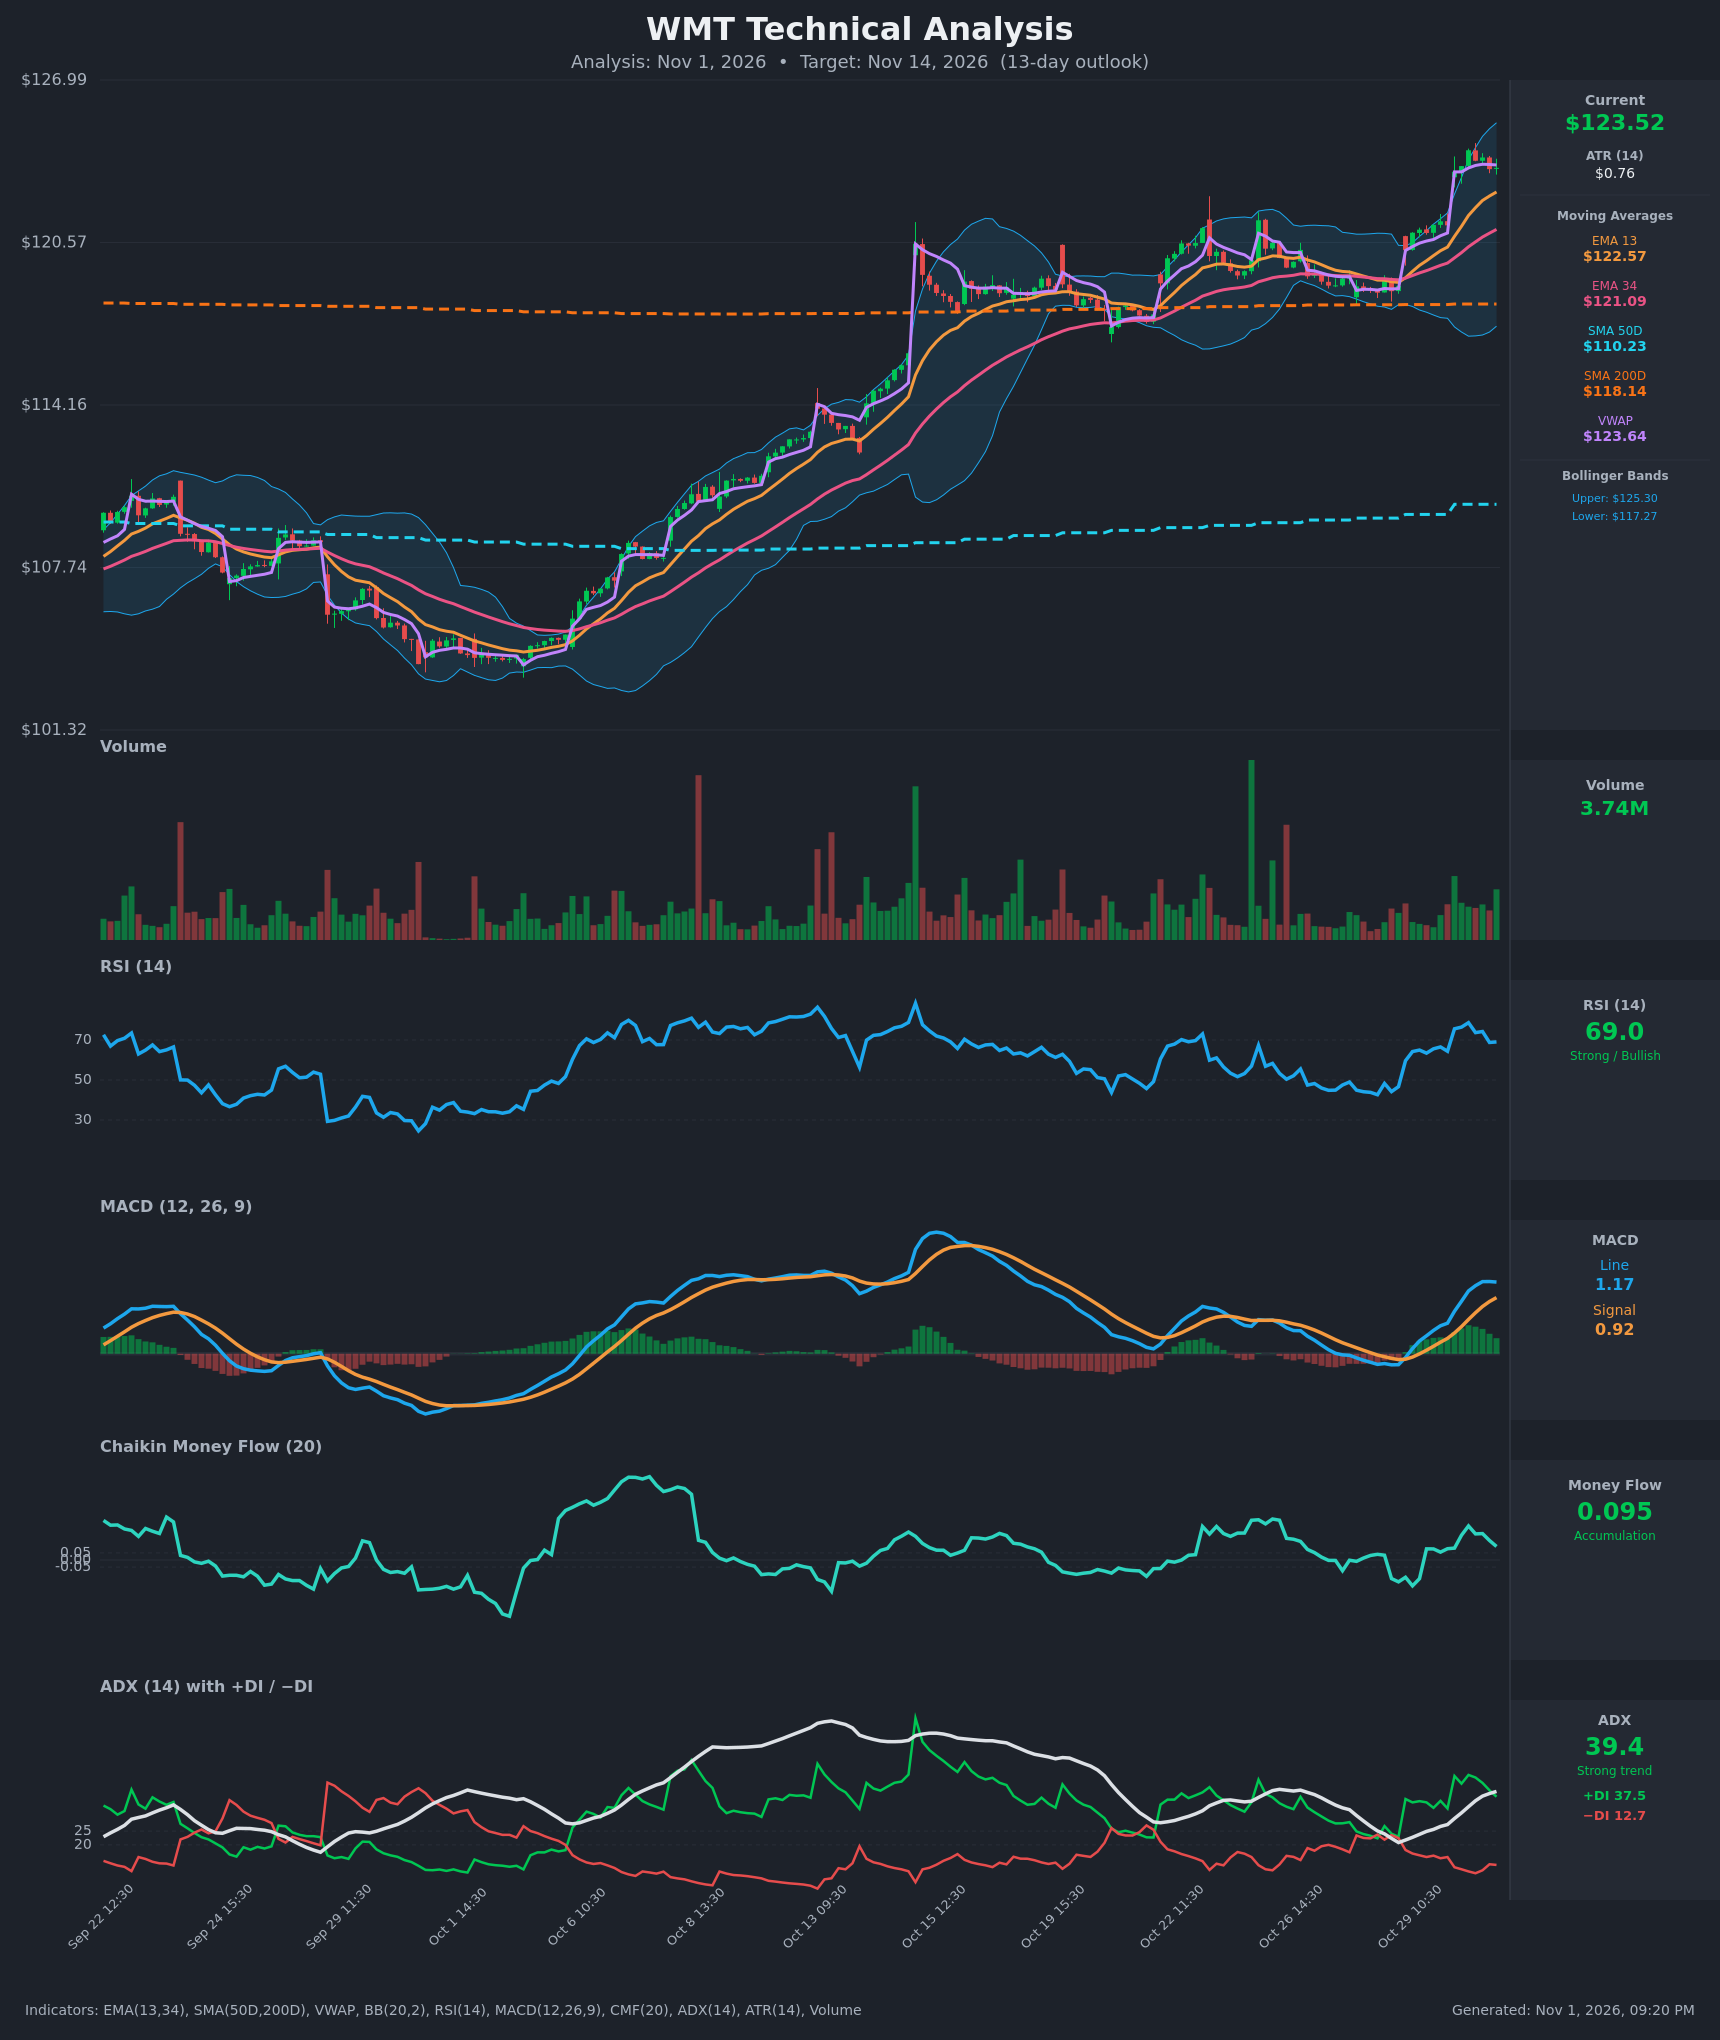
- RSI (14): 69.04, just under the 70 overbought line. It peaked at 78.7 on Oct 30 11:30 and has cooled while price held near highs. Momentum is strong but off its peak. [Bullish]
- 20 EMA: Not shown directly, so I use the EMA 13 ($122.57) and EMA 34 ($121.09) as proxies. Price at $123.52 sits above both, and EMA13 crossed above EMA34 on Oct 29. The spread is widening, so both act as dynamic support. [Bullish]
- MACD: Line 1.171 is above signal 0.917, a bullish crossover that dates to Oct 29. The histogram is +0.25 but has shrunk from about +0.47 at the Oct 30 11:30 bar. The MACD line has flattened at 1.17–1.18, so upside momentum is stalling a little. [Bullish]
- Bollinger Bands (20): Upper $125.30, lower $117.27, so the bands are wide after the breakout. Price is in the upper third, about $1.78 below the upper band, and it has been riding the upper half since the gap-up on Oct 30. This is trend strength rather than a reversal signal, but little room is left before the band. [Bullish]
- CMF (20): 0.095, above the +0.05 threshold, so there is accumulation. It has been positive since Oct 29 12:30 but is below its Oct 30 high of 0.240, so buying pressure is fading a little. [Accumulation]
- ADX (14): 39.4 and rising, a strong trend. +DI is 37.5 and −DI is 12.7, so bulls are firmly in control. A 25-point DI gap is a very strong trend, though a reading near 40 can also mark a mature move. [Strong Trend – Bullish]
- Volume: 3.74M on the latest bar, roughly average against recent bars and well below the spikes on gap days. The Oct 30 breakout came on a green volume bar, which confirms it. Follow-through volume has been unremarkable. [Neutral to mildly Bullish]
DIVERGENCES & TRENDS
- Mild momentum fade: The MACD histogram has fallen for four straight bars, and RSI has dropped from 78.7 to 69.0. Price only edged back from $124.22 to $123.52. This is not a full divergence, but it shows short-term momentum cooling after a vertical move.
- Bullish crossovers: EMA13 crossed above EMA34 on Oct 29, and the MACD line crossed above signal on Oct 29. Price is above SMA200D ($118.14), which points to a long-term uptrend.
- SMA50D vs SMA200D: SMA50D ($110.23) is still below SMA200D ($118.14), so there is no golden cross yet. SMA50D is rising steadily, and a golden cross is a longer-term possibility, not a 13-day event.
- ADX: ADX has turned up from about 20 to 39.4 while +DI jumped from the low 20s to the high 30s and −DI collapsed to 12.7. This confirms a fresh, strong trend start.
- VWAP: Price ($123.52) is marginally below VWAP ($123.64). This is neutral, since VWAP is anchored to the gap-up level. A loss of this level would be the first sign of a pause.
- Extension from mean: Price is about 4.6% above SMA200D and about 12% above SMA50D, so it is stretched. Pullbacks to the EMA13/EMA34 area are common in this setup.
CHART PATTERNS
- Bullish continuation after range breakout (ascending triangle / rectangle break): Price consolidated from roughly Oct 8 to Oct 29 in a $117–$121.5 range, where it repeatedly held the SMA200D area. It then broke out above the range with a gap and green volume. This resembles the Ascending Triangle breakout in the reference diagram.
- Measured move: The range height is about $4.5–$5 ($117–$121.5/122), so the projection from the breakout is roughly $126–$127. That is near the chart's recent high zone.
- Bullish flag/pennant potential: The tight sideways action since the gap, between about $123 and $124.2, looks like a small pause or flag at the highs. A breakout above $124.25–$125.30 would validate the pattern. A break below $122.50 would turn it into a failed breakout or a deeper pullback toward $121.
- Gap fill risk: The Oct 30 gap started around $121.3, so $121.1–$121.3 (EMA34 and gap base) is the key retest zone if the pullback scenario plays out.
POTENTIAL SCENARIOS
- Scenario 1: Bullish Trend Continuation — The ADX 39 trend persists, and price holds above the EMA13 and breaks the small pause at highs. Trigger: a close above $124.25 with volume, then a push through the upper Bollinger Band at $125.30. Target: $125.50–$127.00 (measured move from the range breakout). Invalidation: a daily close below $121.10 (EMA34 and gap base). (50% probability)
- Scenario 2: Bearish Pullback / Mean Reversion — The stretched RSI, fading MACD histogram and fading CMF lead to a retracement toward the rising moving averages. Trigger: a break below VWAP and the EMA13 at $122.57 on rising volume. Target: $121.10–$119.50 (EMA34 and gap fill). Invalidation: a reclaim of $124.25. (30% probability)
- Scenario 3: Neutral Consolidation Below the Upper Band — Price digests the gap between the EMA13 and the upper Bollinger Band while the indicators cool. Trigger: indecisive closes between $122.50 and $125.30. Target: $122.50–$125.00. Invalidation: a close outside that range. (20% probability)
PRICE TARGETS
Timeframe: 13 days (Nov 14, 2026). Range width check: $128.50 − $119.00 = $9.50, which is about 7.7% of $123.52. This fits the 7-10 day to 14-21 day guidance and is wider than a 2-3 day range.
- Target Price: $125.00 (about +1.2%; the trend favors a push toward the upper Bollinger Band with some resistance and a cooling-off drag)
- Expected Range: $119.00 to $128.50
- Key Levels: Support at $122.57 (EMA13), with deeper support at $121.09 (EMA34), Resistance at $125.30 (upper Bollinger Band), with extension resistance near $126.99 (chart high)
OVERALL BIAS
OVERALL BIAS: BULLISH - A strong, rising ADX (39.4) with +DI far above −DI, price above all key moving averages, a bullish MACD and EMA crossover, and a fresh breakout from a multi-week range with positive CMF. Near-term risk is a pullback to the $121–$122.5 area, given RSI near 70, a fading MACD histogram and the upper Bollinger Band close by, so conviction is moderate.
This is educational analysis and not financial advice.