TSLA 13-day bullish forecast — Nov 1, 2026
- Bias: Bullish
- Timeframe: 13 days (made Nov 1, 2026, target date Nov 13, 2026)
- Price at analysis: $399.83
- Price target: $405.50
- Expected range: $383.00 – $423.00
- Result: Incorrect (-3.2%) — closed at $387.04 on Nov 13, 2026; quality score 46/100
Get a free AI analysis of TSLA today
Analysis
TECHNICAL INDICATORS
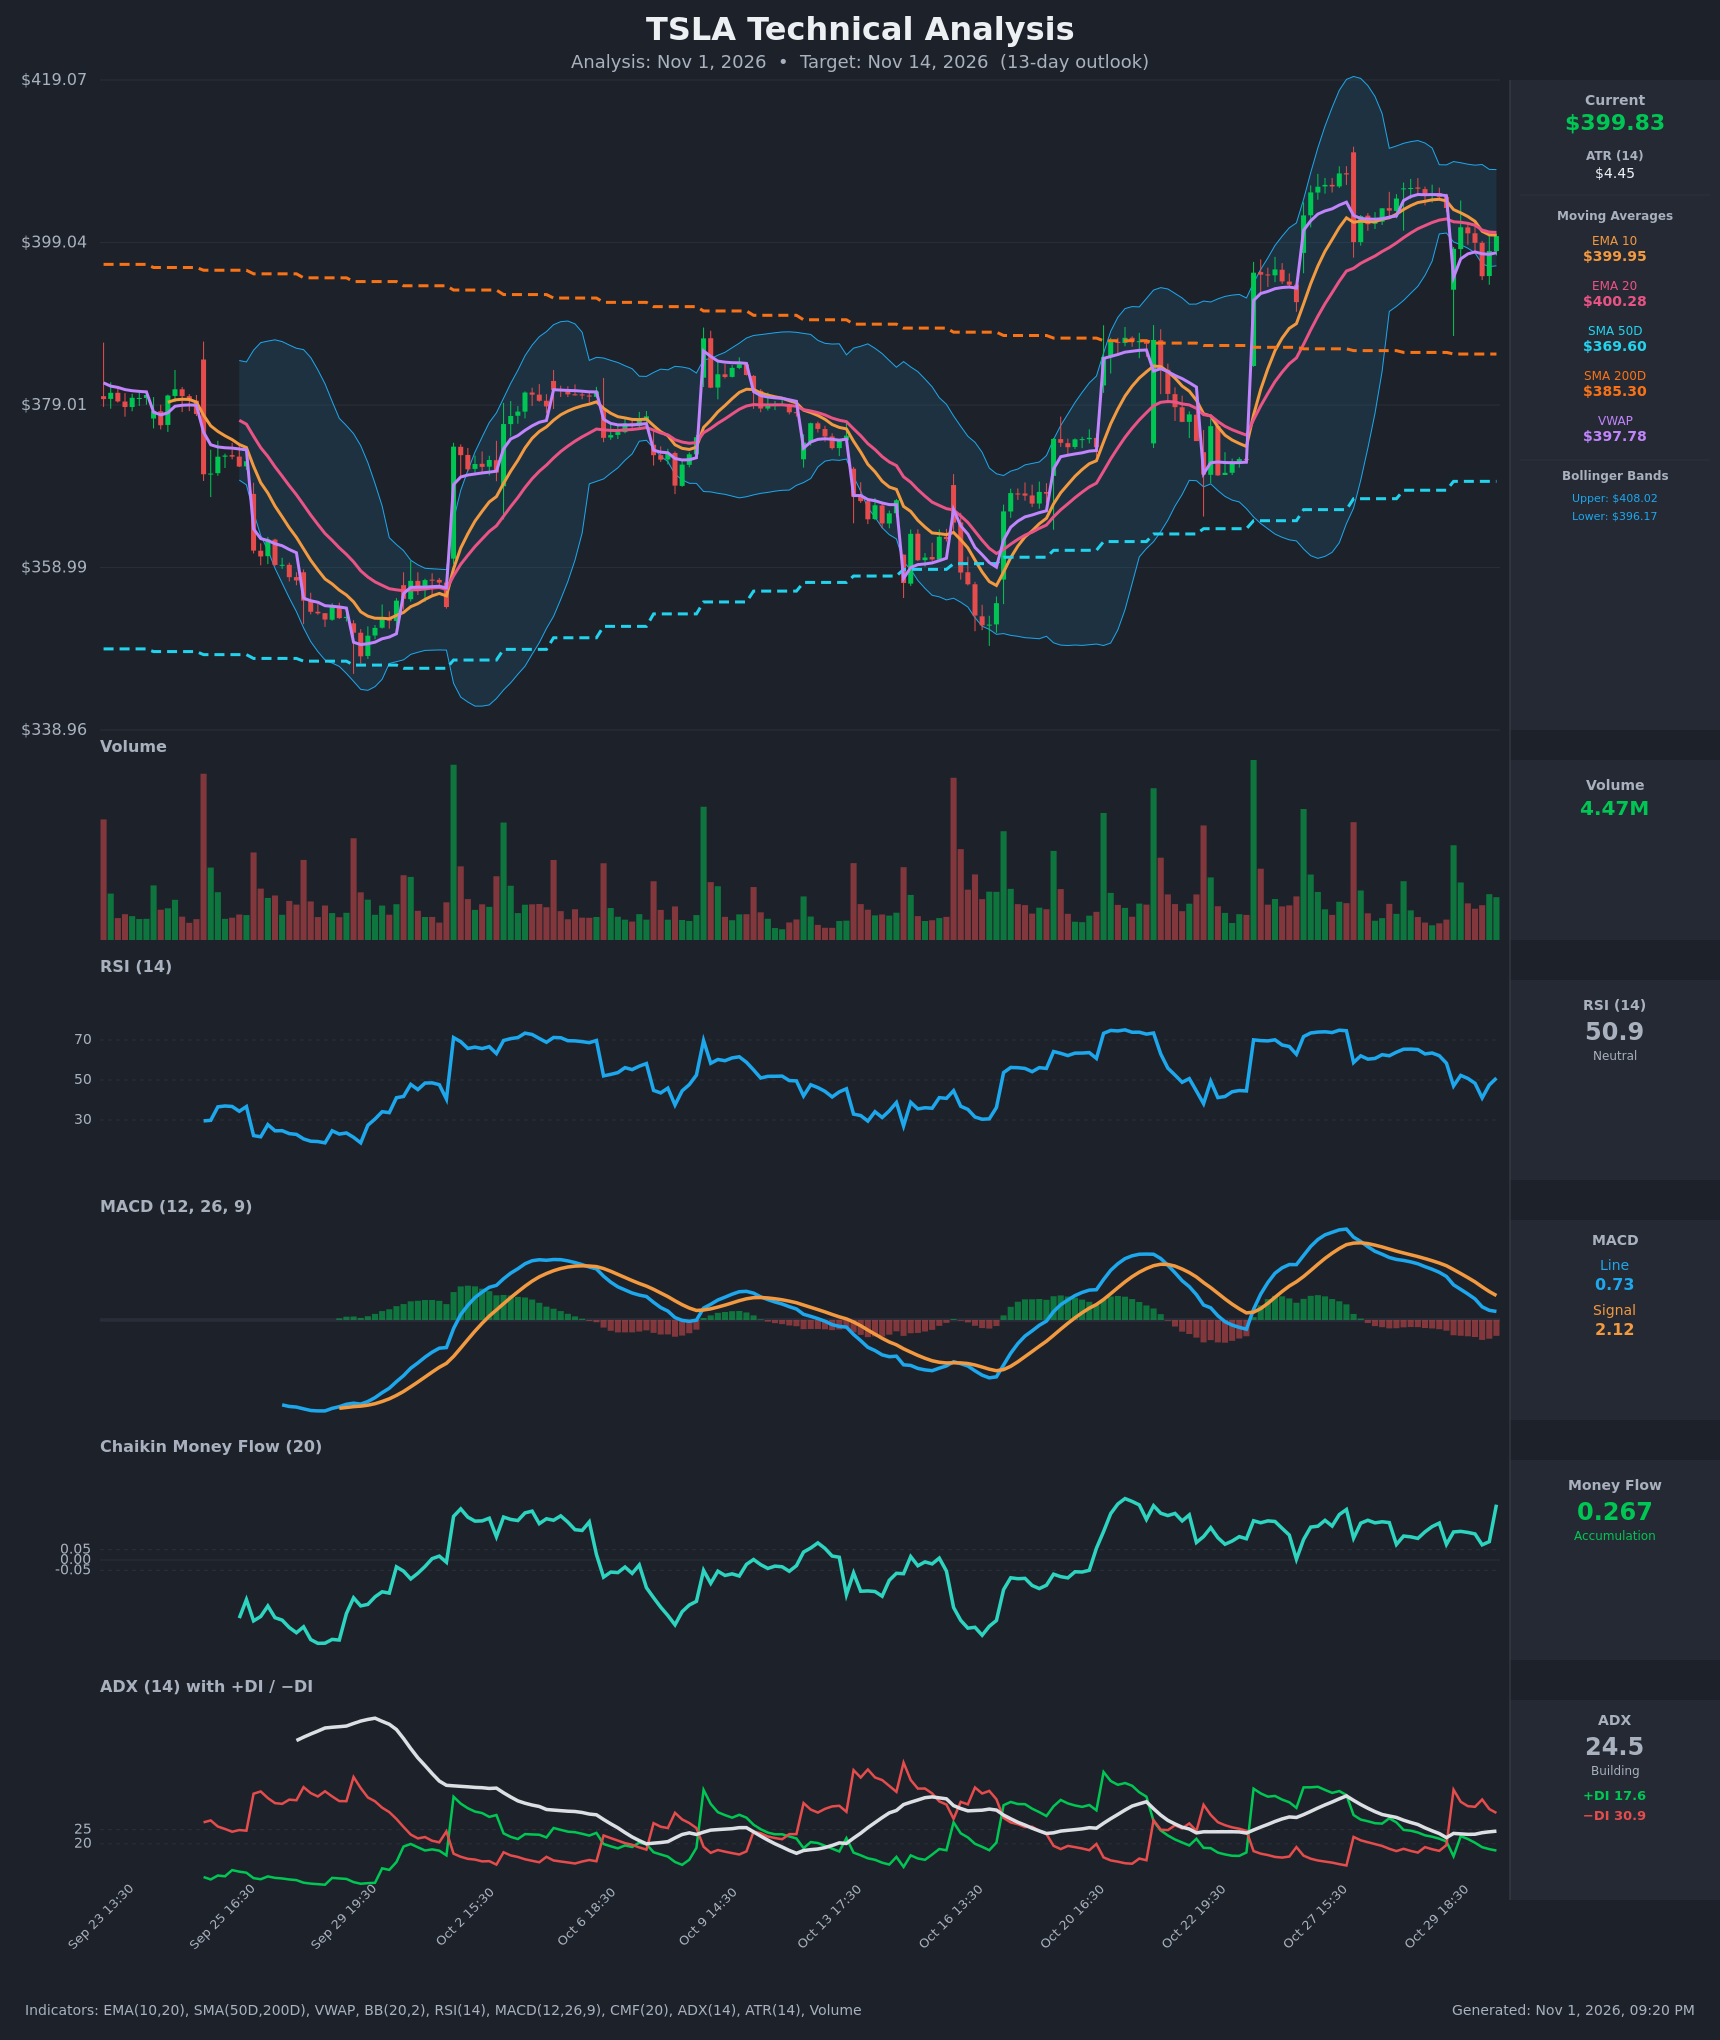
- RSI (14): 50.94, dead neutral. It has rebounded from 41.0 (Oct 30 17:30) after falling from the mid-60s. Momentum is turning up from the dip but has not yet shown follow-through. [Neutral]
- 20 EMA: $400.28, with EMA10 at $399.95. Price ($399.83) sits just under both, so they act as marginal resistance. EMA10 is below EMA20, a mild short-term bearish cross that appeared on Oct 30 17:30. The EMAs are flat and tightly bunched, which signals indecision. [Neutral]
- MACD: Line 0.73 is below signal 2.12, a bearish crossover that occurred around Oct 29 and has persisted. The histogram is about -1.38. It widened to roughly -1.74 and has narrowed over the last two bars, which hints at bearish momentum fading. Still a bearish configuration overall. [Bearish]
- Bollinger Bands (20): Upper $408.02, lower $396.17, midline about $402.10. Price is in the lower half of the bands. The bands have contracted sharply from the late-October expansion, which points to a volatility squeeze and a pending directional move. There is no band walk. [Neutral]
- CMF (20): 0.267, well above +0.05 and at a recent high (up from 0.089). Accumulation has been sustained throughout the pullback, which suggests dips are being bought. [Accumulation]
- ADX (14): 24.5, just under the 25 threshold and edging up. −DI (30.9) is well above +DI (17.6), so bears hold directional control. Most of the DI gap came from the Oct 30 opening gap down, and +DI has recovered only slightly since. [Moderate Trend – Bearish direction]
- Volume: 4.47M, about average, with no spike on the sell-off or the rebound. The Oct 30 drop did not come on climactic volume, so there is no heavy distribution evidence. [Neutral]
Other trend context:
- Price is above SMA50 ($369.60) and SMA200 ($385.30), a long-term uptrend.
- SMA50 is rising and SMA200 is falling, so a golden cross is a possible medium-term development, but it has not happened yet.
- Price is above VWAP ($397.78), a modest buy-side tilt.
DIVERGENCES & TRENDS
- Price vs. CMF: CMF is rising to 0.267 while price has slipped from about $405 to $400. This is a mild bullish divergence, with money flow stronger than price.
- MACD: It has been rolling over since its late-October peak, and the bearish cross is intact. The histogram shrank on the last two bars, an early sign of bearish momentum exhaustion.
- RSI: It dropped from the 60s to 41 and has recovered to 51, with no clear divergence.
- DI lines: −DI is dominant, but it has been easing off its spike (39 to 31). A +DI/−DI cross has not occurred.
- Moving averages: EMA10 has crossed just below EMA20, though the spread is only about $0.33. Price oscillates around the EMAs, which is typical consolidation behavior.
- Structure: Price has made higher lows and higher highs since the Oct 16 low near $349, and is now consolidating between about $395 and $406.
CHART PATTERNS
- Bullish Flag / Pennant (continuation): After the sharp rally from about $349 to $405, price is consolidating in a tightening range, $394.88 to $405.76, with contracting Bollinger Bands. A break above about $406 would project a measured move toward $415–$420 (flag-pole retracement logic). This is the most fitting reference pattern.
- Symmetrical Triangle (neutral/continuation): The tightening highs and lows also resemble a symmetrical triangle. The prior trend is up, which favors an upside resolution, but the bearish MACD and DI readings leave downside breaks possible.
- Failure risk: A close below about $394.88 would invalidate the flag and open a retest of the mid-$380s (SMA200 at $385.30).
POTENTIAL SCENARIOS
- Scenario 1: Bullish Flag Breakout — Strong CMF accumulation and the long-term uptrend carry price out of the consolidation. The MACD histogram turns up and price reclaims the EMAs and the BB midline. Trigger: close above $406 (the recent high and upper-band region) with rising volume. Target: $415–$420. Invalidation: close below $394.88. (45% probability)
- Scenario 2: Bearish Breakdown — Bears keep control (−DI dominant, MACD below signal), and price loses the lower Bollinger Band and the Oct 30 low. Trigger: close below $394.88. Target: $385 (SMA200 area), with an extension toward $380. Invalidation: reclaim of $402 (BB midline) and a MACD bullish cross. (35% probability)
- Scenario 3: Neutral Range Chop — The squeeze persists and price oscillates between roughly $395 and $406 without a decisive break. Trigger: failure of both the $406 and $394.88 levels to break on a closing basis. Target: $398–$404. Invalidation: a daily close outside the $394–$407 range. (20% probability)
PRICE TARGETS
Range-width check: the expected range is $383.00 to $423.00, a $40 width, or about 10.0% of the current price. That fits the 8-12% guidance for a 13-day timeframe.
- Target Price: $405.50 (13 days, Nov 14, 2026)
- Expected Range: $383.00 to $423.00
- Key Levels: Support at $394.88, Resistance at $408.02
OVERALL BIAS
OVERALL BIAS: BULLISH - Price is above both the 50- and 200-day SMAs and VWAP, and CMF at 0.267 shows strong sustained accumulation. The tight consolidation after a sharp rally resembles a bullish flag. The bearish MACD and −DI dominance keep conviction modest, with $394.88 as the key invalidation level.
This is educational analysis and not financial advice.