BB 13-day bearish forecast — Nov 1, 2026
- Bias: Bearish
- Timeframe: 13 days (made Nov 1, 2026, target date Nov 13, 2026)
- Price at analysis: $8.41
- Price target: $8.20
- Expected range: $7.82 – $8.62
- Result: Incorrect (+4.2%) — closed at $8.77 on Nov 13, 2026; quality score 26/100
Get a free AI analysis of BB today
Analysis
TECHNICAL INDICATORS
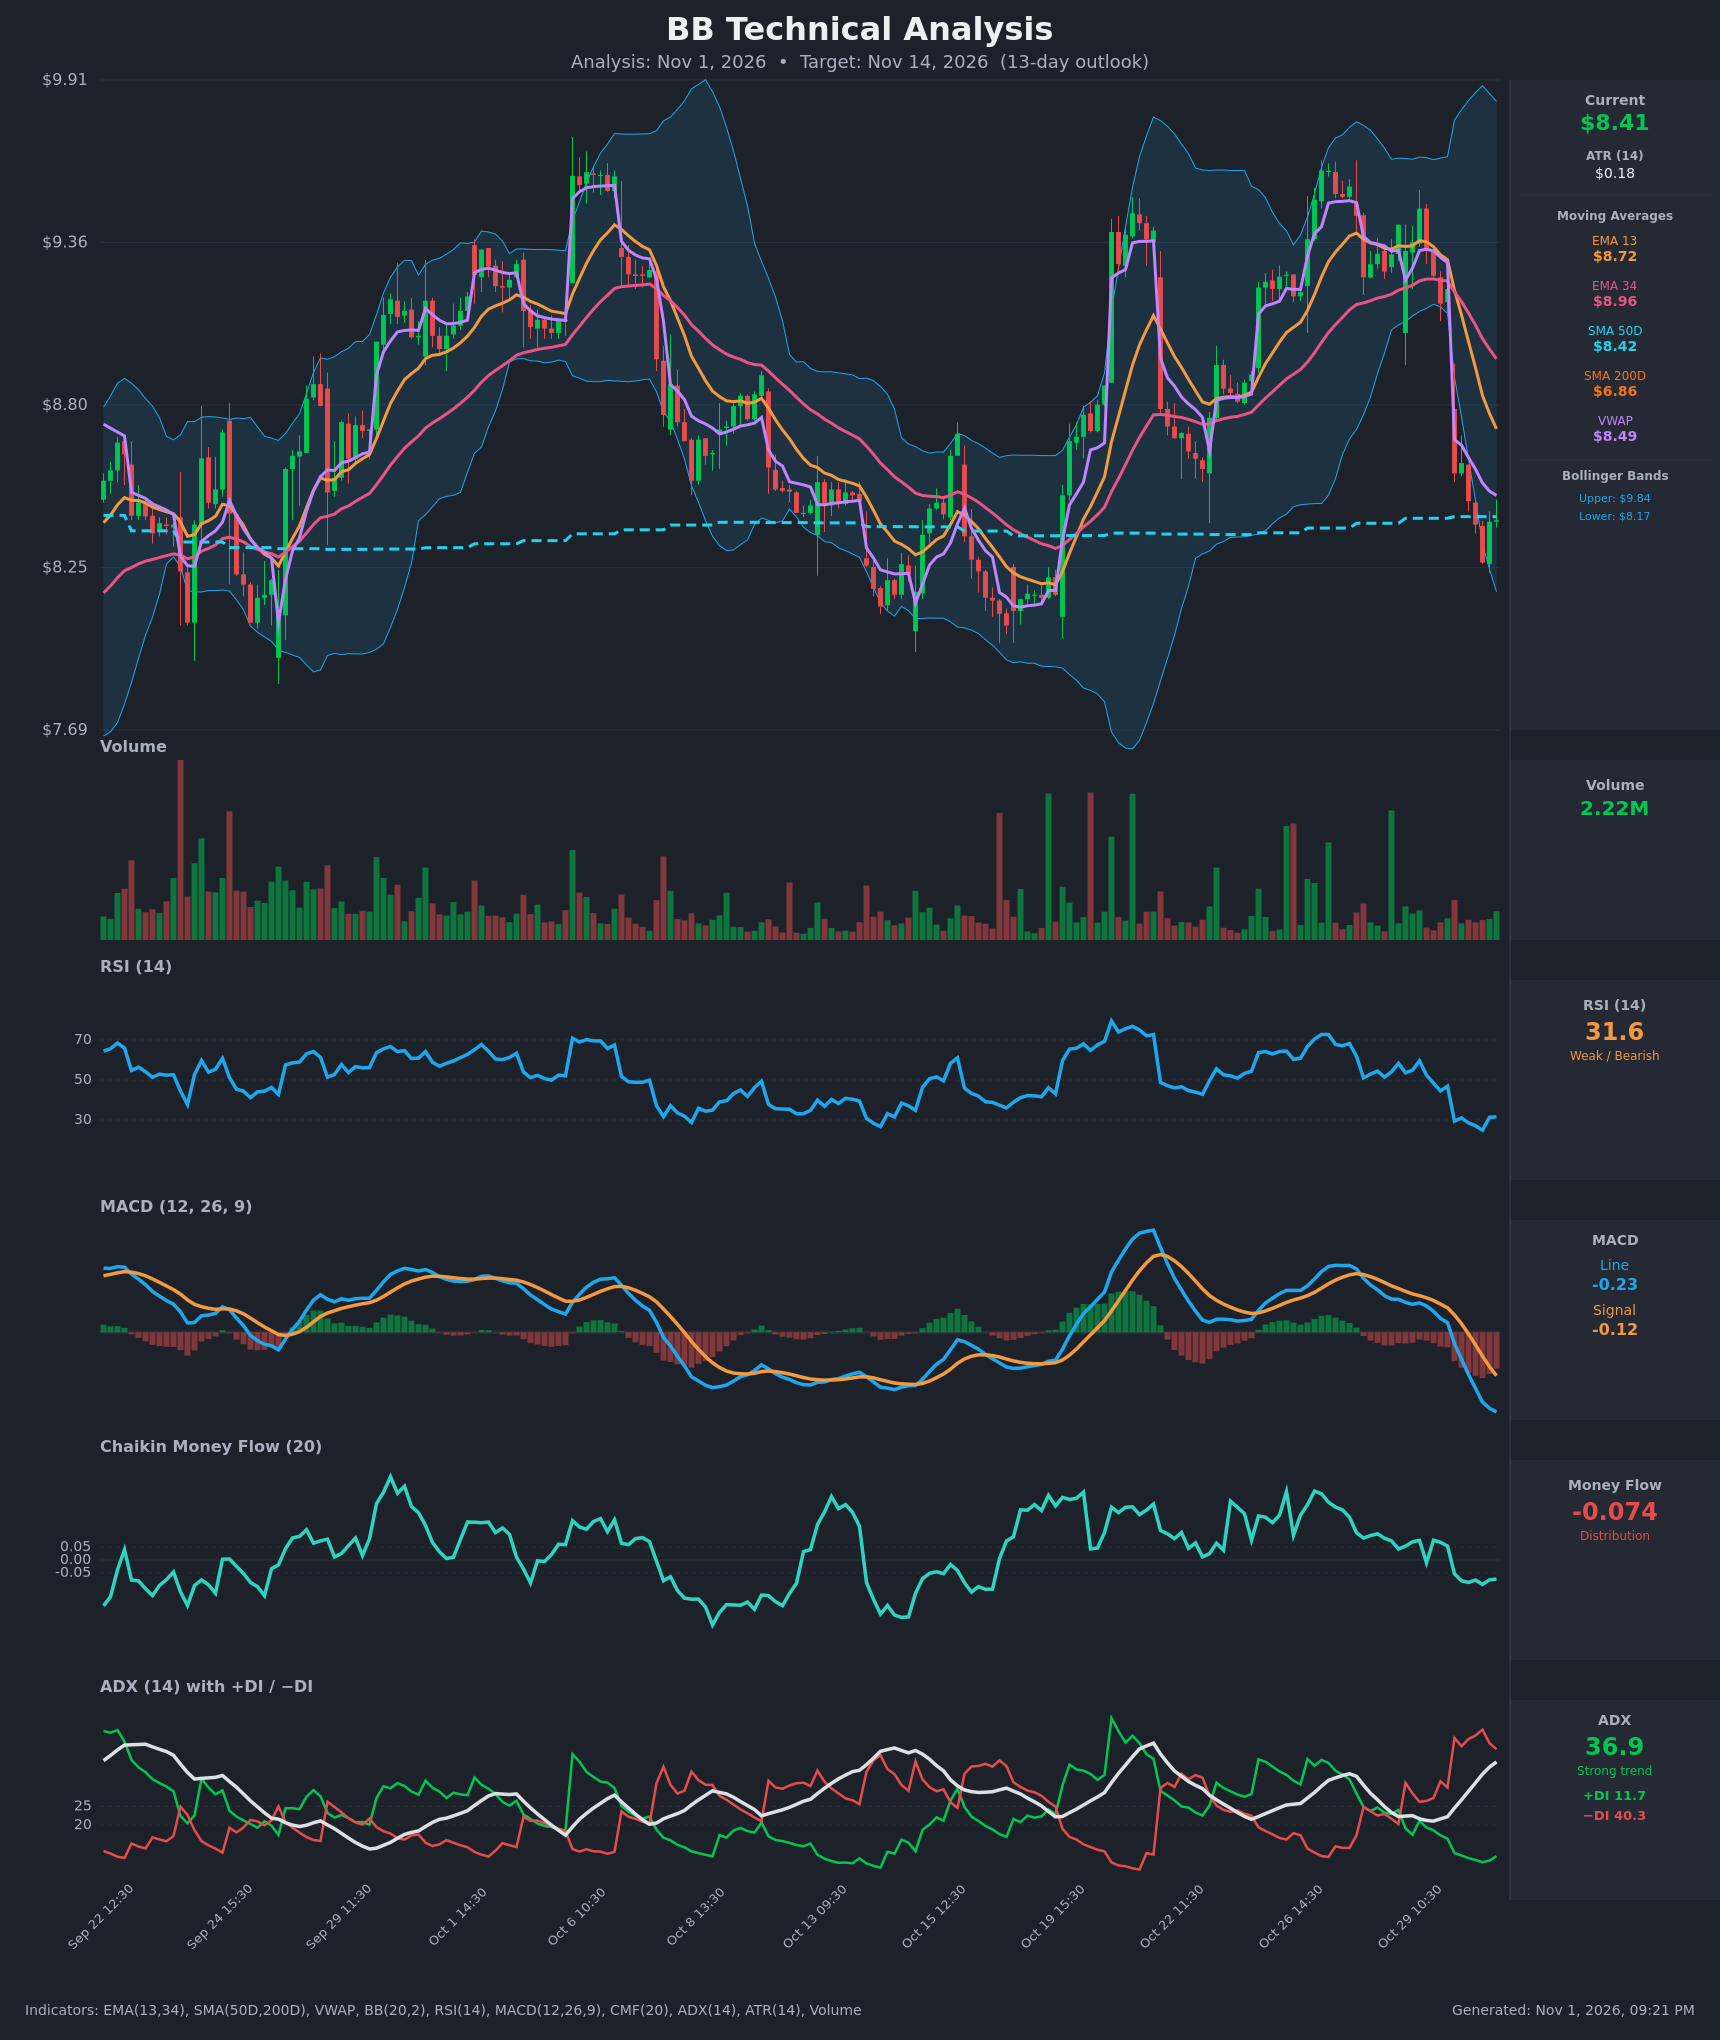
- RSI (14): 31.58, just off an Oct 30 low of 24.9 and near oversold. It fell from 58 to the low 30s in two sessions, so momentum is still pointing down. The small bounce from the low is not yet a reversal. [Bearish]
- 20 EMA: The supplied data uses EMA 13 at $8.72 and EMA 34 at $8.96. Price at $8.41 is below both. EMA 13 crossed below EMA 34 on Oct 30 (about 9.11 vs 9.16 at 10:30), a bearish cross. Both averages are sloping down and act as overhead resistance. [Bearish]
- MACD: Line at -0.227, signal at -0.124, histogram negative (about -0.10) and widening. The line is well below the signal and has crossed below zero. It is the lowest MACD reading on the chart, so momentum is stretched but still falling. [Bearish]
- Bollinger Bands (20): Lower band $8.17, upper $9.84, so the bands are wide after the earlier volatility. Price is in the bottom of the range, about $0.24 above the lower band. A close below $8.17 would be a band-walk signal, but being near the lower band also raises the odds of a mean-reversion bounce toward the midline, which sits near $9.0 and is falling. [Bearish]
- CMF (20): -0.074, below the -0.05 threshold, after turning from positive (+0.07) on Oct 29. Selling pressure is increasing. [Distribution]
- ADX (14): 36.9 and rising (from 22 on Oct 29), with −DI at 40.3 far above +DI at 11.7. This is a strong, established downtrend with the bears clearly in control. [Strong Trend – Bearish]
- Volume: 2.22M, ordinary compared with prior spikes. The Oct 30 gap-down came on moderate volume, which means there is no capitulation spike yet. Without a volume flush, a durable bottom is less likely. [Neutral-to-Bearish]
- Other levels:
- VWAP is $8.49, just above price, which is acting as resistance.
- SMA50D is $8.42, essentially equal to price, and is a pivot.
- SMA200D is $6.86, far below, so the long-term trend is still up. It gives no near-term support.
DIVERGENCES & TRENDS
- There is no bullish RSI or MACD divergence. Both made new lows together with price, which confirms the downside momentum.
- All trend indicators agree: ADX rose from 22 to 37 as −DI jumped from 30 to 43, and CMF flipped negative.
- Crossovers this week:
- EMA 13 crossed below EMA 34.
- MACD fell below zero.
- Price lost both EMAs and VWAP.
- The Oct 30 gap-down (9.20 → 8.57) was a violent break from the Oct 28 high near $9.5.
- Price is sitting on the SMA50D ($8.42), which has held as support in earlier tests. A decisive close below it opens the $8.0–8.2 zone.
- RSI near 30 is a caution for chasing shorts. Prior oversold readings (late Sept, Oct 8–15) were followed by bounces, so rallies toward the declining EMA 13 are possible.
CHART PATTERNS
- Bearish Triple Top (range top): Highs near $9.4–9.6 on Oct 6, Oct 21–22 and Oct 27–28 were rejected each time. The "neckline" is the $8.0–8.2 swing-low zone. A close below it would project a measured move toward about $6.9–7.2, but that is well beyond a 13-day horizon.
- Bearish continuation after the gap-down: The break below EMA 13/34 and VWAP with a −DI surge looks like a failed breakout from the upper range. The expected path is a drift toward the lower band and the $8.0–8.2 range floor.
- Wide multi-week range ($7.95–$9.6): Price is in the lower third. This raises the chance of a bounce near $8.0–8.2, but the downtrend indicators are stronger than the range-support argument.
POTENTIAL SCENARIOS
- Scenario 1: Bearish Trend Continuation to Range Floor — The strong −DI dominance and negative MACD/CMF carry price lower. Rallies are sold at VWAP/EMA 13, and price tests the lower Bollinger Band and the Oct 15–19 lows. Trigger: a close below the SMA50D ($8.42) and the lower band ($8.17). Target: $8.20, with extension to $7.95–8.05. Invalidation: a daily close above $8.72 (EMA 13). (55% probability)
- Scenario 2: Bullish Oversold Bounce — RSI near 30 and the lower band cause short covering. Price recovers toward VWAP and EMA 13 and stalls below the declining EMA 34. Trigger: a hold above $8.17–8.25 and a reclaim of VWAP ($8.49). Target: $8.72–8.96. Invalidation: a close below $8.17. (35% probability)
- Scenario 3: Neutral Choppy Base — Price oscillates around the SMA50D ($8.42) as the selling slows. Trigger: low-volume range trading between $8.20 and $8.65. Target: $8.35–8.50. Invalidation: a break outside $8.15–$8.75. (10% probability)
PRICE TARGETS
- Target Price: $8.20 (13-day horizon)
- Expected Range: $7.82 to $8.62 (width $0.80, about 9.5% of the current price, consistent with the 8–12% guide for this horizon)
- Key Levels: Support at $8.17 (lower Bollinger Band, with the $7.95–8.05 range lows below), Resistance at $8.72 (EMA 13, with VWAP at $8.49 as first resistance)
OVERALL BIAS
OVERALL BIAS: BEARISH - Strong, rising ADX (36.9) with −DI (40.3) far above +DI (11.7), a bearish MACD below zero, price below the EMAs and VWAP, and negative CMF all favor continuation toward the $8.0–8.2 range floor. The oversold RSI (31.6) argues for a bounce along the way, so conviction is moderate.
This is educational analysis and not financial advice.