IWM 13-day bearish forecast — Nov 1, 2026
- Bias: Bearish
- Timeframe: 13 days (made Nov 1, 2026, target date Nov 13, 2026)
- Price at analysis: $279.34
- Price target: $277.20
- Expected range: $270.80 – $283.40
- Result: Correct (-1.4%) — closed at $275.46 on Nov 13, 2026; quality score 100/100
Get a free AI analysis of IWM today
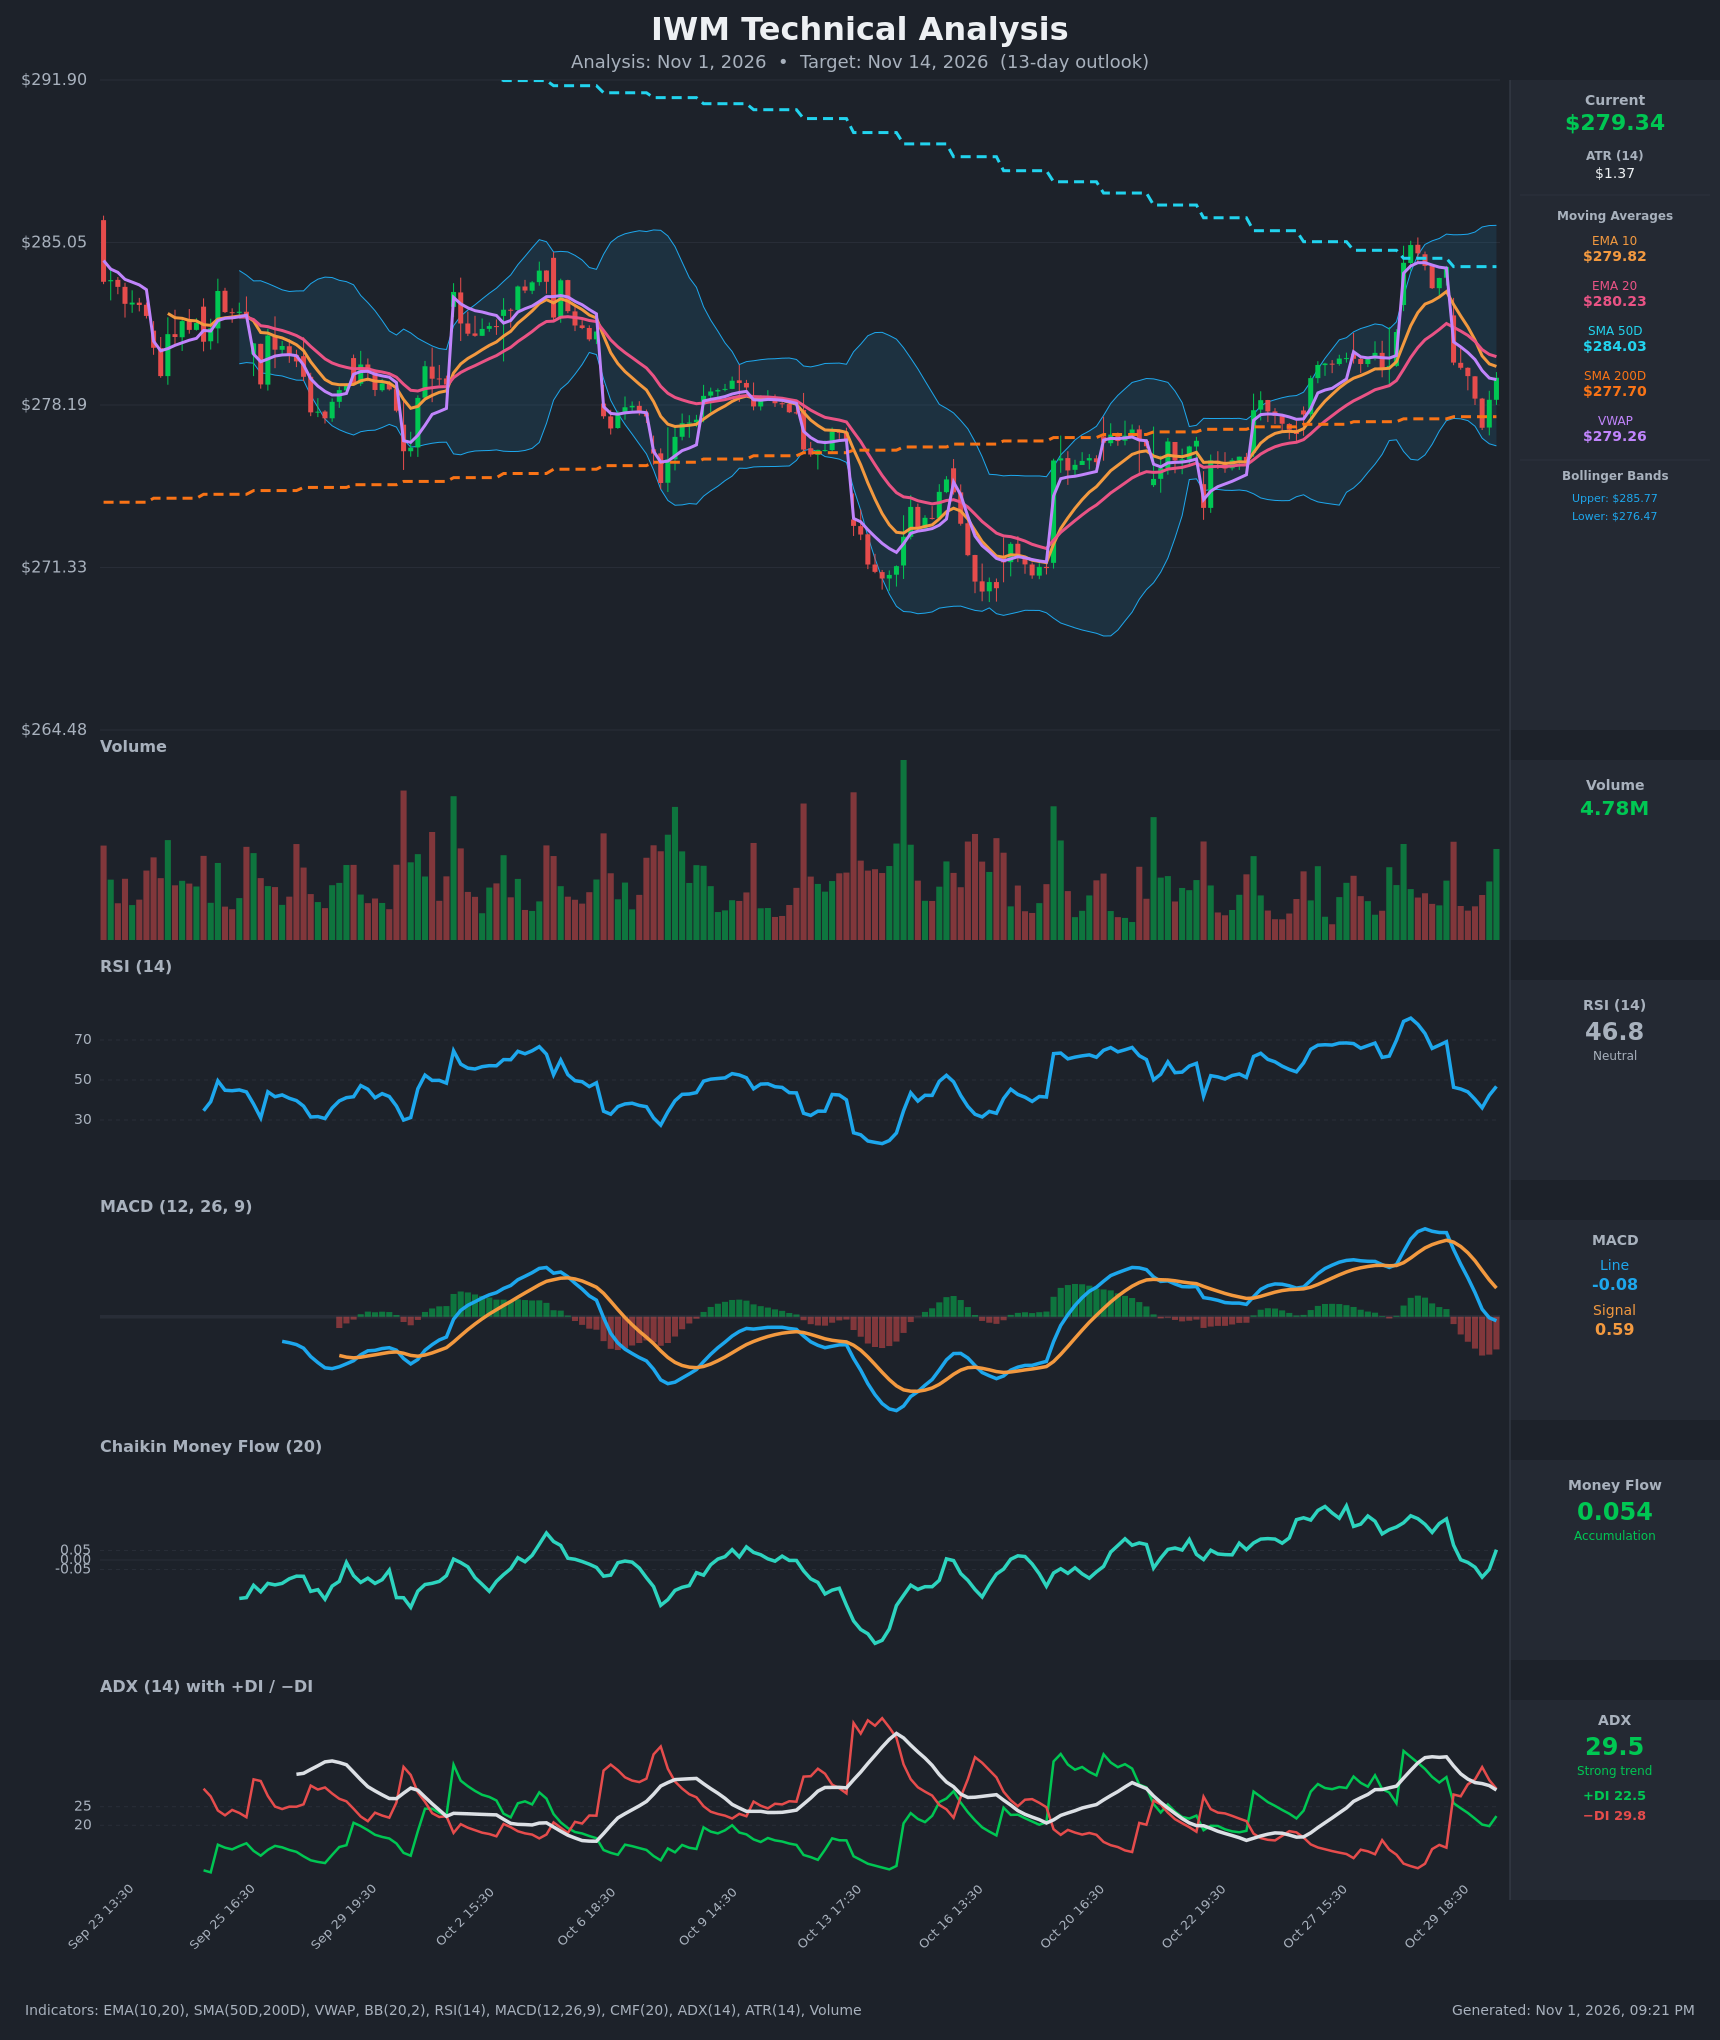
Analysis
TECHNICAL INDICATORS
- RSI (14): 46.79, bouncing from a low of 36.1 after falling from 81 on Oct 29. It sits below the 50 midline, so momentum is neutral to slightly weak, though the latest bar is a recovery. [Neutral]
- 20 EMA: $280.23, with price at $279.34 just below it. EMA10 ($279.82) has crossed below EMA20, a short-term bearish cross. The EMA20 is nearby resistance. [Bearish]
- MACD: Line -0.08 has crossed below signal 0.59, and the histogram is negative (about -0.67). The line has fallen from a 1.8 peak. Momentum is bearish but starting to flatten. [Bearish]
- Bollinger Bands (20): Upper $285.77, lower $276.47, midline about $281.1. Price is in the lower half, below the midline, and about $2.9 above the lower band. There is no squeeze, and the bands are moderately wide. [Neutral]
- CMF (20): 0.054, just above the +0.05 threshold and recovering from -0.09. The reading is marginal accumulation and has not been sustained. [Neutral]
- ADX (14): 29.5 and falling from 38. −DI (29.8) is above +DI (22.5), and the DI crossover on Oct 30 favors sellers. The trend is still strong but fading, with bears slightly in control. [Strong Trend, Bearish]
- Volume: 4.78M, around average. The latest bar is a green uptick on slightly higher volume, and the sell-off bars were not extreme. This suggests a modest bounce attempt but no strong conviction. [Neutral]
DIVERGENCES & TRENDS
- Price made a lower low at $277.23 on Oct 30 with RSI at 36.1. RSI is now rebounding to 46.8, an early sign of selling exhaustion, but there is no formal divergence.
- The MACD bearish cross, the EMA10/EMA20 bearish cross and the −DI/+DI bearish cross all happened within the last 1-2 sessions. That is a cluster of short-term bearish signals.
- Price is above SMA200D ($277.70) and below SMA50D ($284.03). It is in a pullback within a longer-term uptrend and is testing the long-term support zone.
- The SMA50D is above the SMA200D (a golden cross is already in place), so the long-term structure is intact.
- VWAP ($279.26) is almost exactly at price, which is neutral.
- The Oct 29 high near $285 was rejected right at the SMA50D and the upper Bollinger Band, and the sell-off since has been sharp.
CHART PATTERNS
- Price formed a lower high at the SMA50D/upper band and is now sliding back toward the SMA200D support. This resembles a Bearish Double Top or range-top rejection, with the neckline around $277-278, which is also the SMA200D and lower band.
- Over the longer view, price has been in a roughly $271-$285 range with a bullish recovery off the Oct 17 low. The pattern is not clean.
- If the SMA200D/$277 neckline breaks, the measured downside is about $270-272. If it holds, a bounce back toward $283-284 is likely.
POTENTIAL SCENARIOS
- Scenario 1: Bearish Break of SMA200D — The cluster of bearish crosses (MACD, EMA, DI) leads to a sustained break below $277, with the double-top style rejection at $285 playing out. Trigger: close below $277.20 with ADX holding above 25. Target: $272-$274. Invalidation: close above $281.50 (EMA20/VWAP zone). (40% probability)
- Scenario 2: Bullish Bounce off 200-day SMA — The SMA200D and lower Bollinger Band hold, RSI turns up from 36, and CMF stays positive. Price retests the middle band. Trigger: reclaim of the EMA20 at $280.25. Target: $282.50-$284. Invalidation: close below $276.50. (35% probability)
- Scenario 3: Neutral Range Chop — Price oscillates around the $276.50-$281.50 band as ADX fades. Trigger: failure to break either side. Target: $278-$280. Invalidation: a daily close outside $276-$282. (25% probability)
PRICE TARGETS
Trend momentum, the bearish crosses and the DI lean are slightly stronger than the oversold bounce signals, so I take a modest bearish tilt over 13 days.
- Target Price: $277.20 (13-day)
- Expected Range: $270.80 to $283.40 (width $12.60 = 4.5% of current price. This is wider than a short-term range but kept within the realistic volatility envelope, given ATR $1.37 and the 13-day scale.)
- Key Levels: Support at $277.70 (SMA200D), then $276.47 (lower band); Resistance at $280.23 (EMA20), then $284.03 (SMA50D)
OVERALL BIAS
OVERALL BIAS: BEARISH - A cluster of fresh bearish signals (MACD cross below signal, EMA10 below EMA20, −DI above +DI, price rejected at the SMA50D) points to a test of the 200-day SMA support, with a modest downside lean over 13 days. The SMA200D and the RSI rebound keep conviction modest.
This is educational analysis and not financial advice.