KWEB 13-day bearish forecast — Nov 1, 2026
- Bias: Bearish
- Timeframe: 13 days (made Nov 1, 2026, target date Nov 13, 2026)
- Price at analysis: $22.75
- Price target: $22.35
- Expected range: $21.90 – $23.70
- Result: Correct (+0.7%) — closed at $22.90 on Nov 13, 2026; quality score 100/100
Get a free AI analysis of KWEB today
Analysis
TECHNICAL INDICATORS
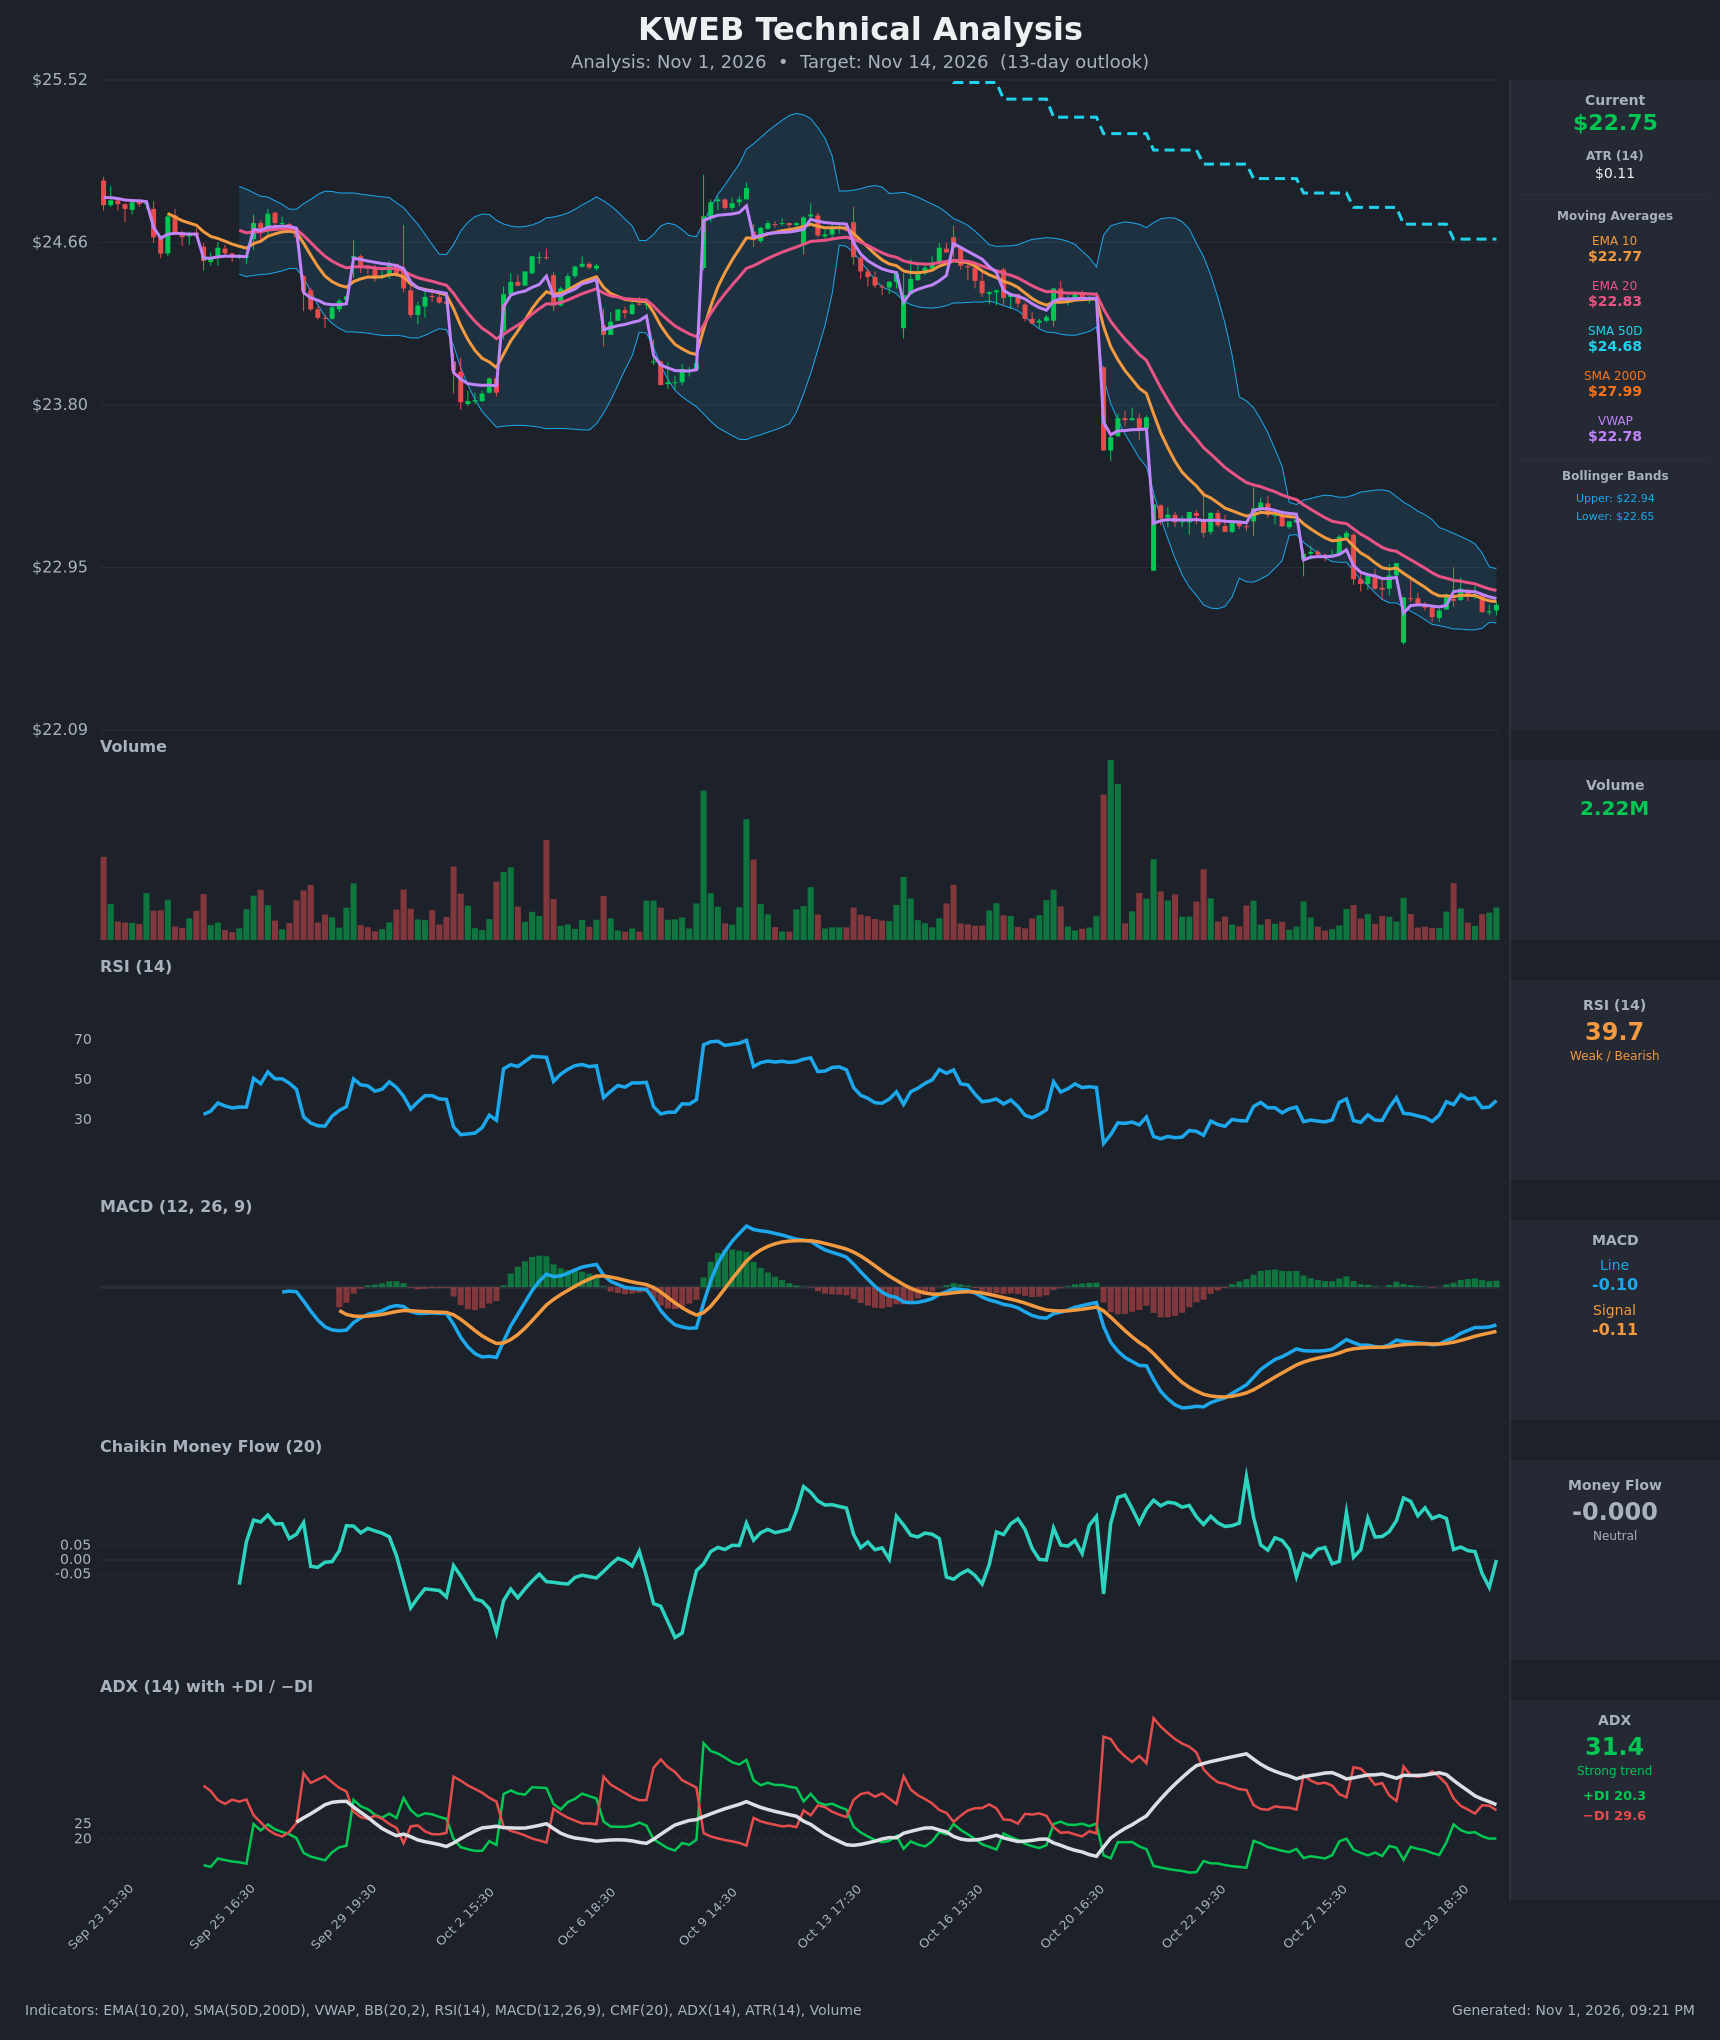
- RSI (14): 39.70. It is below 50 but above the oversold 30 line. It dipped to ~29 on Oct 29 and has bounced to the high 30s/low 40s, so downside momentum is stalling but there is no real bullish reversal yet. [Bearish]
- 20 EMA: $22.83, with the EMA 10 at $22.77. Price at $22.75 is below both, and EMA10 is below EMA20 (bearish alignment). Price is also well below the SMA50D ($24.68) and SMA200D ($27.99). The 20 EMA is overhead resistance. [Bearish]
- MACD: Line -0.097 is above signal -0.114, a mild bullish crossover that began around Oct 29-30. The histogram is slightly positive and rising, but everything is still below zero. This is a bounce in momentum inside a downtrend, not a trend change. [Neutral]
- Bollinger Bands (20): Upper $22.94, lower $22.65. The bands have narrowed sharply (width ~$0.29, about 1.3% of price) after the Oct 21 breakdown. Price sits in the lower half of the bands and has been riding the lower band. The squeeze signals a coming volatility expansion, and the downtrend favors a downside resolution. [Bearish]
- CMF (20): -0.000, flat between -0.05 and +0.05. It has faded from +0.2 on Oct 29 to zero, so buying pressure has evaporated without turning into distribution. [Neutral]
- ADX (14): 31.4, a strong trend, though it is falling from 41. −DI (29.6) is above +DI (20.3), so bears are in control. The falling ADX and narrowing DI spread suggest the trend is maturing and consolidating. [Strong Trend – Bearish]
- Volume: 2.22M, below average and muted compared with the heavy-volume breakdown around Oct 21. Low volume on the grind lower and the small bounce shows no strong conviction from either side. The VWAP at $22.78 is just above price, a slight seller-side edge. [Neutral/Slightly Bearish]
DIVERGENCES & TRENDS
- Price made new lows around Oct 29-30 while the MACD line rose from -0.148 to -0.097. That is a mild bullish MACD divergence and suggests selling momentum is fading.
- RSI also made a slightly higher low (~29 to ~36) against the lower price lows, a minor bullish divergence.
- CMF has fallen from +0.2 to 0 even as price stays flat, so accumulation is not confirming any bounce.
- The SMA50D is far below the SMA200D (a death cross already in place), and price is below both. The long-term trend is clearly down.
- The EMA10 is below the EMA20 with no bullish crossover. The 20 EMA ($22.83) and VWAP ($22.78) are immediate overhead hurdles.
- ADX is declining from 41 to 31 with −DI still dominant. This points to a consolidation within the downtrend rather than a reversal.
CHART PATTERNS
- After the sharp gap-down on Oct 21 (~$24.2 to ~$23.1), price has stair-stepped lower in a tight, narrowing range. This resembles a Bearish Flag/Pennant from the reference diagram. It is a continuation pattern, and a breakdown below ~$22.45-$22.55 would confirm it.
- The measured move from the pole (~$1.2) projects to roughly $21.9-$22.0. That is likely a multi-week target, so only part of it is realistic within 13 days.
- The Bollinger squeeze adds to the case for a volatility expansion. The bullish MACD and RSI divergences are why an upside break back above $22.95 cannot be ruled out. That would be a failed pattern and a relief rally toward the SMA50D.
POTENTIAL SCENARIOS
- Scenario 1: Bearish Flag Breakdown — Price fails at the 20 EMA/VWAP zone and breaks below the recent lows as the squeeze resolves lower, with −DI still dominant. Trigger: close below ~$22.50 on rising volume. Target: $22.00-$22.35. Invalidation: daily close above $23.00. (50% probability)
- Scenario 2: Bullish Relief Bounce — Bullish MACD crossover and RSI divergence fuel a snapback above the EMAs and the upper Bollinger Band. Trigger: close above $22.95 with expanding volume. Target: $23.40-$23.60. Invalidation: loss of $22.45. (33% probability)
- Scenario 3: Neutral Continued Chop — The squeeze persists and price stays pinned between ~$22.50 and ~$22.95 with no resolution. Trigger: low-volume, ATR-sized daily moves. Target: $22.65-$22.90. Invalidation: a close outside the $22.45-$23.00 range. (17% probability)
PRICE TARGETS
- Target Price: $22.35 (13-day horizon)
- Expected Range: $21.90 to $23.70 (width $1.80, about 7.9% of current price, in line with the 13-day guidance)
- Key Levels: Support at $22.45, Resistance at $22.95
OVERALL BIAS
OVERALL BIAS: BEARISH - Price is below all key moving averages, with −DI above +DI, ADX above 30, and a bearish flag after the Oct 21 breakdown, so trend continuation has the most evidence. The bullish MACD cross and RSI divergence limit conviction and raise the odds of a bounce toward $22.95 first.
This is educational analysis and not financial advice.