QQQ 13-day bearish forecast — Nov 1, 2026
- Bias: Bearish
- Timeframe: 13 days (made Nov 1, 2026, target date Nov 13, 2026)
- Price at analysis: $690.53
- Price target: $683.00
- Expected range: $655.00 – $718.00
- Result: Correct (-2.3%) — closed at $674.35 on Nov 13, 2026; quality score 100/100
Get a free AI analysis of QQQ today
Analysis
TECHNICAL INDICATORS
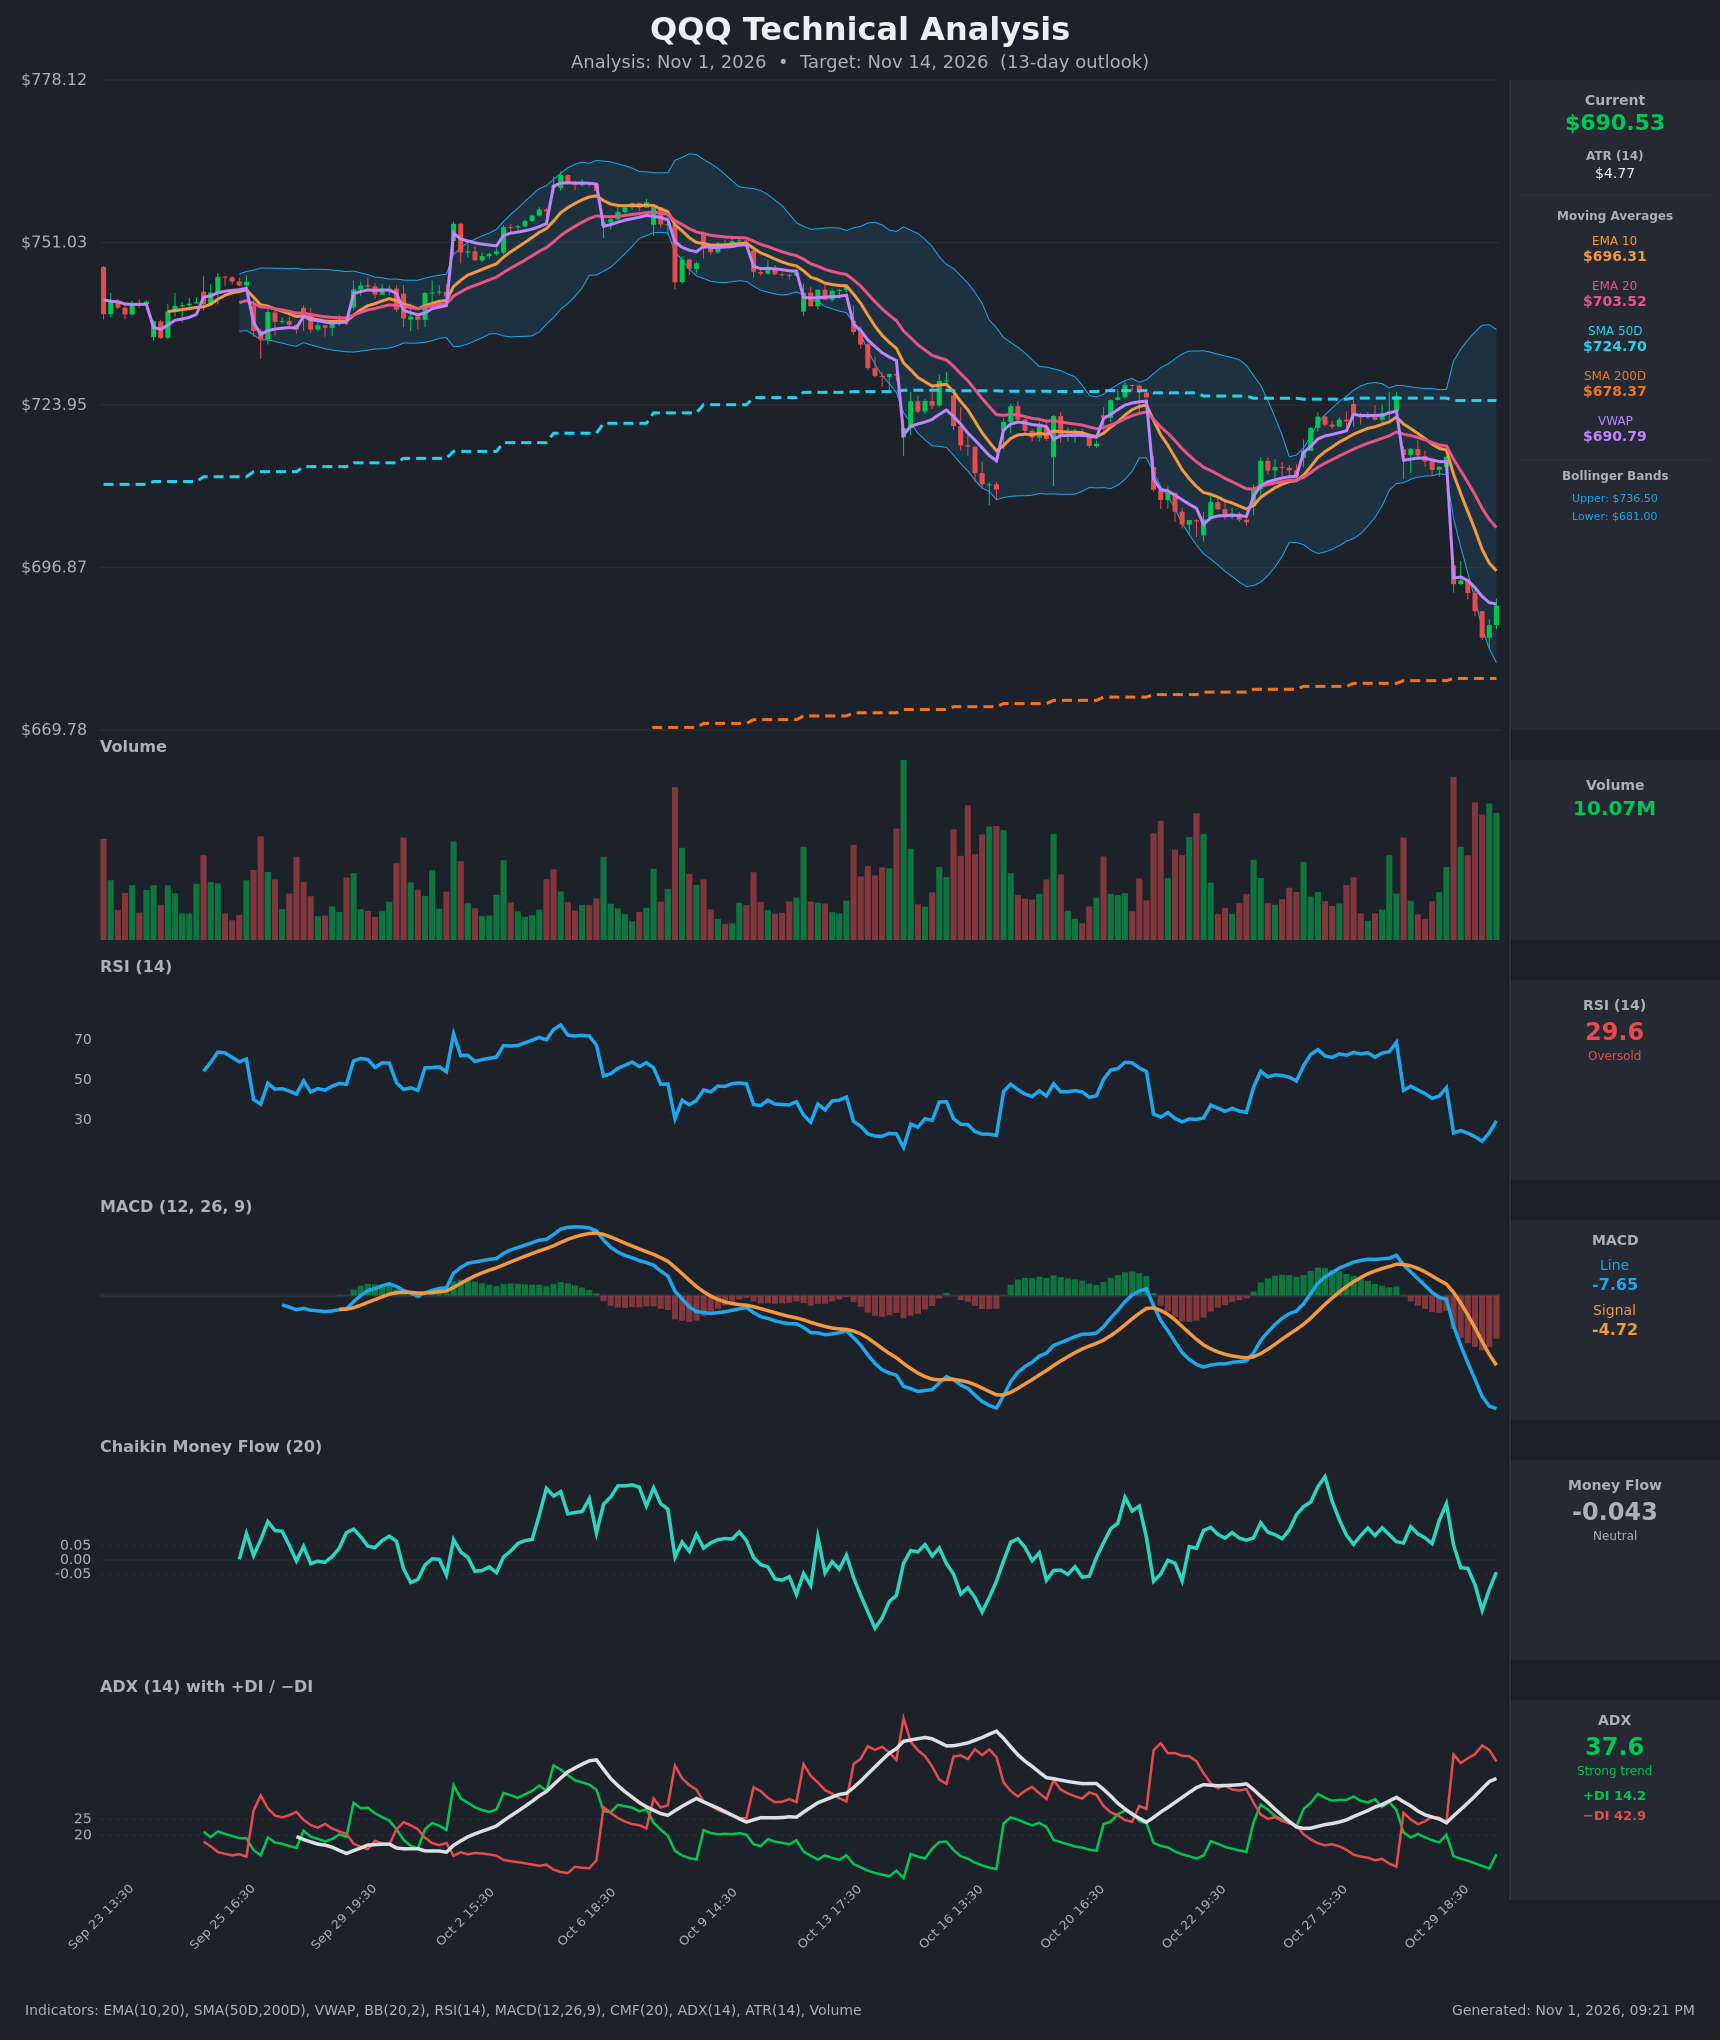
- RSI (14): 29.57, up from a low of 19.4 two bars earlier. The market is oversold and just starting to turn up, but it is still below 30 and in bearish territory. Oversold readings in a strong downtrend can persist or produce only brief bounces. [Neutral]
- 20 EMA: $703.52, with EMA10 at $696.31. Price ($690.53) is below both, and EMA10 crossed below EMA20 on Oct 30. Both averages are sloping steeply down and now act as resistance. [Bearish]
- MACD: Line -7.65 is below the signal at -4.72 after a bearish crossover on Oct 29-30. The histogram is deeply negative and still widening. The line is at its lowest in weeks, which means strong downside momentum. [Bearish]
- Bollinger Bands (20): Upper $736.50, lower $681.00, so the bands have widened sharply. Price is in the bottom 17% of the band, about $9.5 above the lower band. Price walked the lower band after the gap-down. This shows expanding volatility with a downside bias, though it also sets up a mean-reversion bounce. [Bearish]
- CMF (20): -0.043, in the neutral zone (between -0.05 and +0.05). It fell from +0.198 on Oct 29 to -0.176 on Oct 30 and has recovered slightly. Money flow has turned negative but is not yet showing heavy distribution. [Neutral]
- ADX (14): 37.6 and rising, a strong trend. -DI is 42.9 against +DI at 14.2, so bears are firmly in control. +DI ticked up from 9.8 to 14.2 on the last bar, but the gap is very wide. [Strong Trend – Bearish]
- Volume: 10.07M, with the heaviest bars of the recent period clustered on the Oct 30 breakdown. Heavy volume on the decline confirms real selling, not a thin-market drop. The final bar's green candle on high volume hints at some dip-buying. [Bearish with early bounce attempt]
DIVERGENCES & TRENDS
- There is no confirmed bullish divergence. RSI made a new low (19.4) in line with price, and MACD is still making lower lows, so momentum confirms price.
- The RSI hook up from 19.4 to 29.6 is an early oversold bounce, but it has not yet crossed back above 30-40, which is typically needed for a trend-change signal.
- Price lost the Oct 29 consolidation range (~$713-717) with a gap down to ~$694 on Oct 30. It then slid to $685 and is now bouncing at $690.5.
- The SMA50 ($724.70) is well above price. Price is also now below VWAP ($690.79, essentially at VWAP).
- The SMA200 ($678.37) is the next major support, about 1.8% below. SMA50 is above SMA200, so there is no death cross and the long-term structure is still intact.
- The EMA10/EMA20 bearish crossover and the bearish MACD crossover are both fresh. DI is dominated by -DI, and ADX is rising.
CHART PATTERNS
- The closest reference pattern is a Bearish Flag/Pennant continuation (the Oct 22-29 consolidation under SMA50, followed by a gap-down breakdown). The measured move points toward roughly $670-680, close to the SMA200.
- The Oct 6 to Oct 30 progression of lower highs ($751, then ~$735, then ~$725) is consistent with a Bearish Rising Wedge/Head-and-Shoulders-style rollover. Swing lows are now being broken.
- The most plausible bullish alternative is a Falling Wedge / Double Bottom base forming near the SMA200 and lower Bollinger Band. This has no confirmation yet.
- Significance: a break below the SMA200 (~$678) would confirm the continuation and open a move toward $665-670. A recovery above $703 would invalidate the bearish pattern.
POTENTIAL SCENARIOS
- Scenario 1: Bearish Trend Continuation to SMA200 — The strong -DI trend and negative MACD keep pressing price lower. Any bounce stalls at the falling EMA10 (~$696) or EMA20 (~$703), then price retests and probes the SMA200 and lower band. Trigger: rejection at $696-$703 or a close below $685. Target: $678-$670. Invalidation: daily close above $704. (45% probability)
- Scenario 2: Bullish Oversold Bounce / Mean Reversion — RSI is below 30 and price is at the lower band and near the SMA200. A relief rally recovers toward the EMAs and VWAP gap-fill zone. Trigger: close above $697 (EMA10) with RSI back above 40. Target: $703-$715. Invalidation: close below $678 (SMA200). (40% probability)
- Scenario 3: Neutral Base Between SMA200 and EMA10 — Price chops between $678 and $697 as volatility contracts. Trigger: holding the SMA200 while failing at EMA10. Target: $685-$695. Invalidation: close outside $676-$705. (15% probability)
PRICE TARGETS
Timeframe: 13 days. ATR of $4.77 implies a typical 13-day move of roughly ±$17, and the elevated trend and volatility widen the range. Expected range width: $718.00 − $655.00 = $63.00, or about 9.1% of the current price, which fits the 13-day guidance.
- Target Price: $683.00 (13 days)
- Expected Range: $655.00 to $718.00
- Key Levels: Support at $678.37 (SMA200), Resistance at $696.31 (EMA10)
OVERALL BIAS
OVERALL BIAS: BEARISH - ADX is at 37.6 with -DI far above +DI, MACD is below its signal and widening, and price is below all short-term averages and the SMA50 after a heavy-volume breakdown. An oversold bounce toward $696-$703 is likely to meet resistance, with the SMA200 (~$678) as the next downside magnet.
This is educational analysis and not financial advice.