QCOM 13-day bearish forecast — Nov 1, 2026
- Bias: Bearish
- Timeframe: 13 days (made Nov 1, 2026, target date Nov 13, 2026)
- Price at analysis: $164.88
- Price target: $161.50
- Expected range: $155.50 – $170.50
- Result: Incorrect (+3.7%) — closed at $170.90 on Nov 13, 2026; quality score 40/100
Get a free AI analysis of QCOM today
Analysis
TECHNICAL INDICATORS
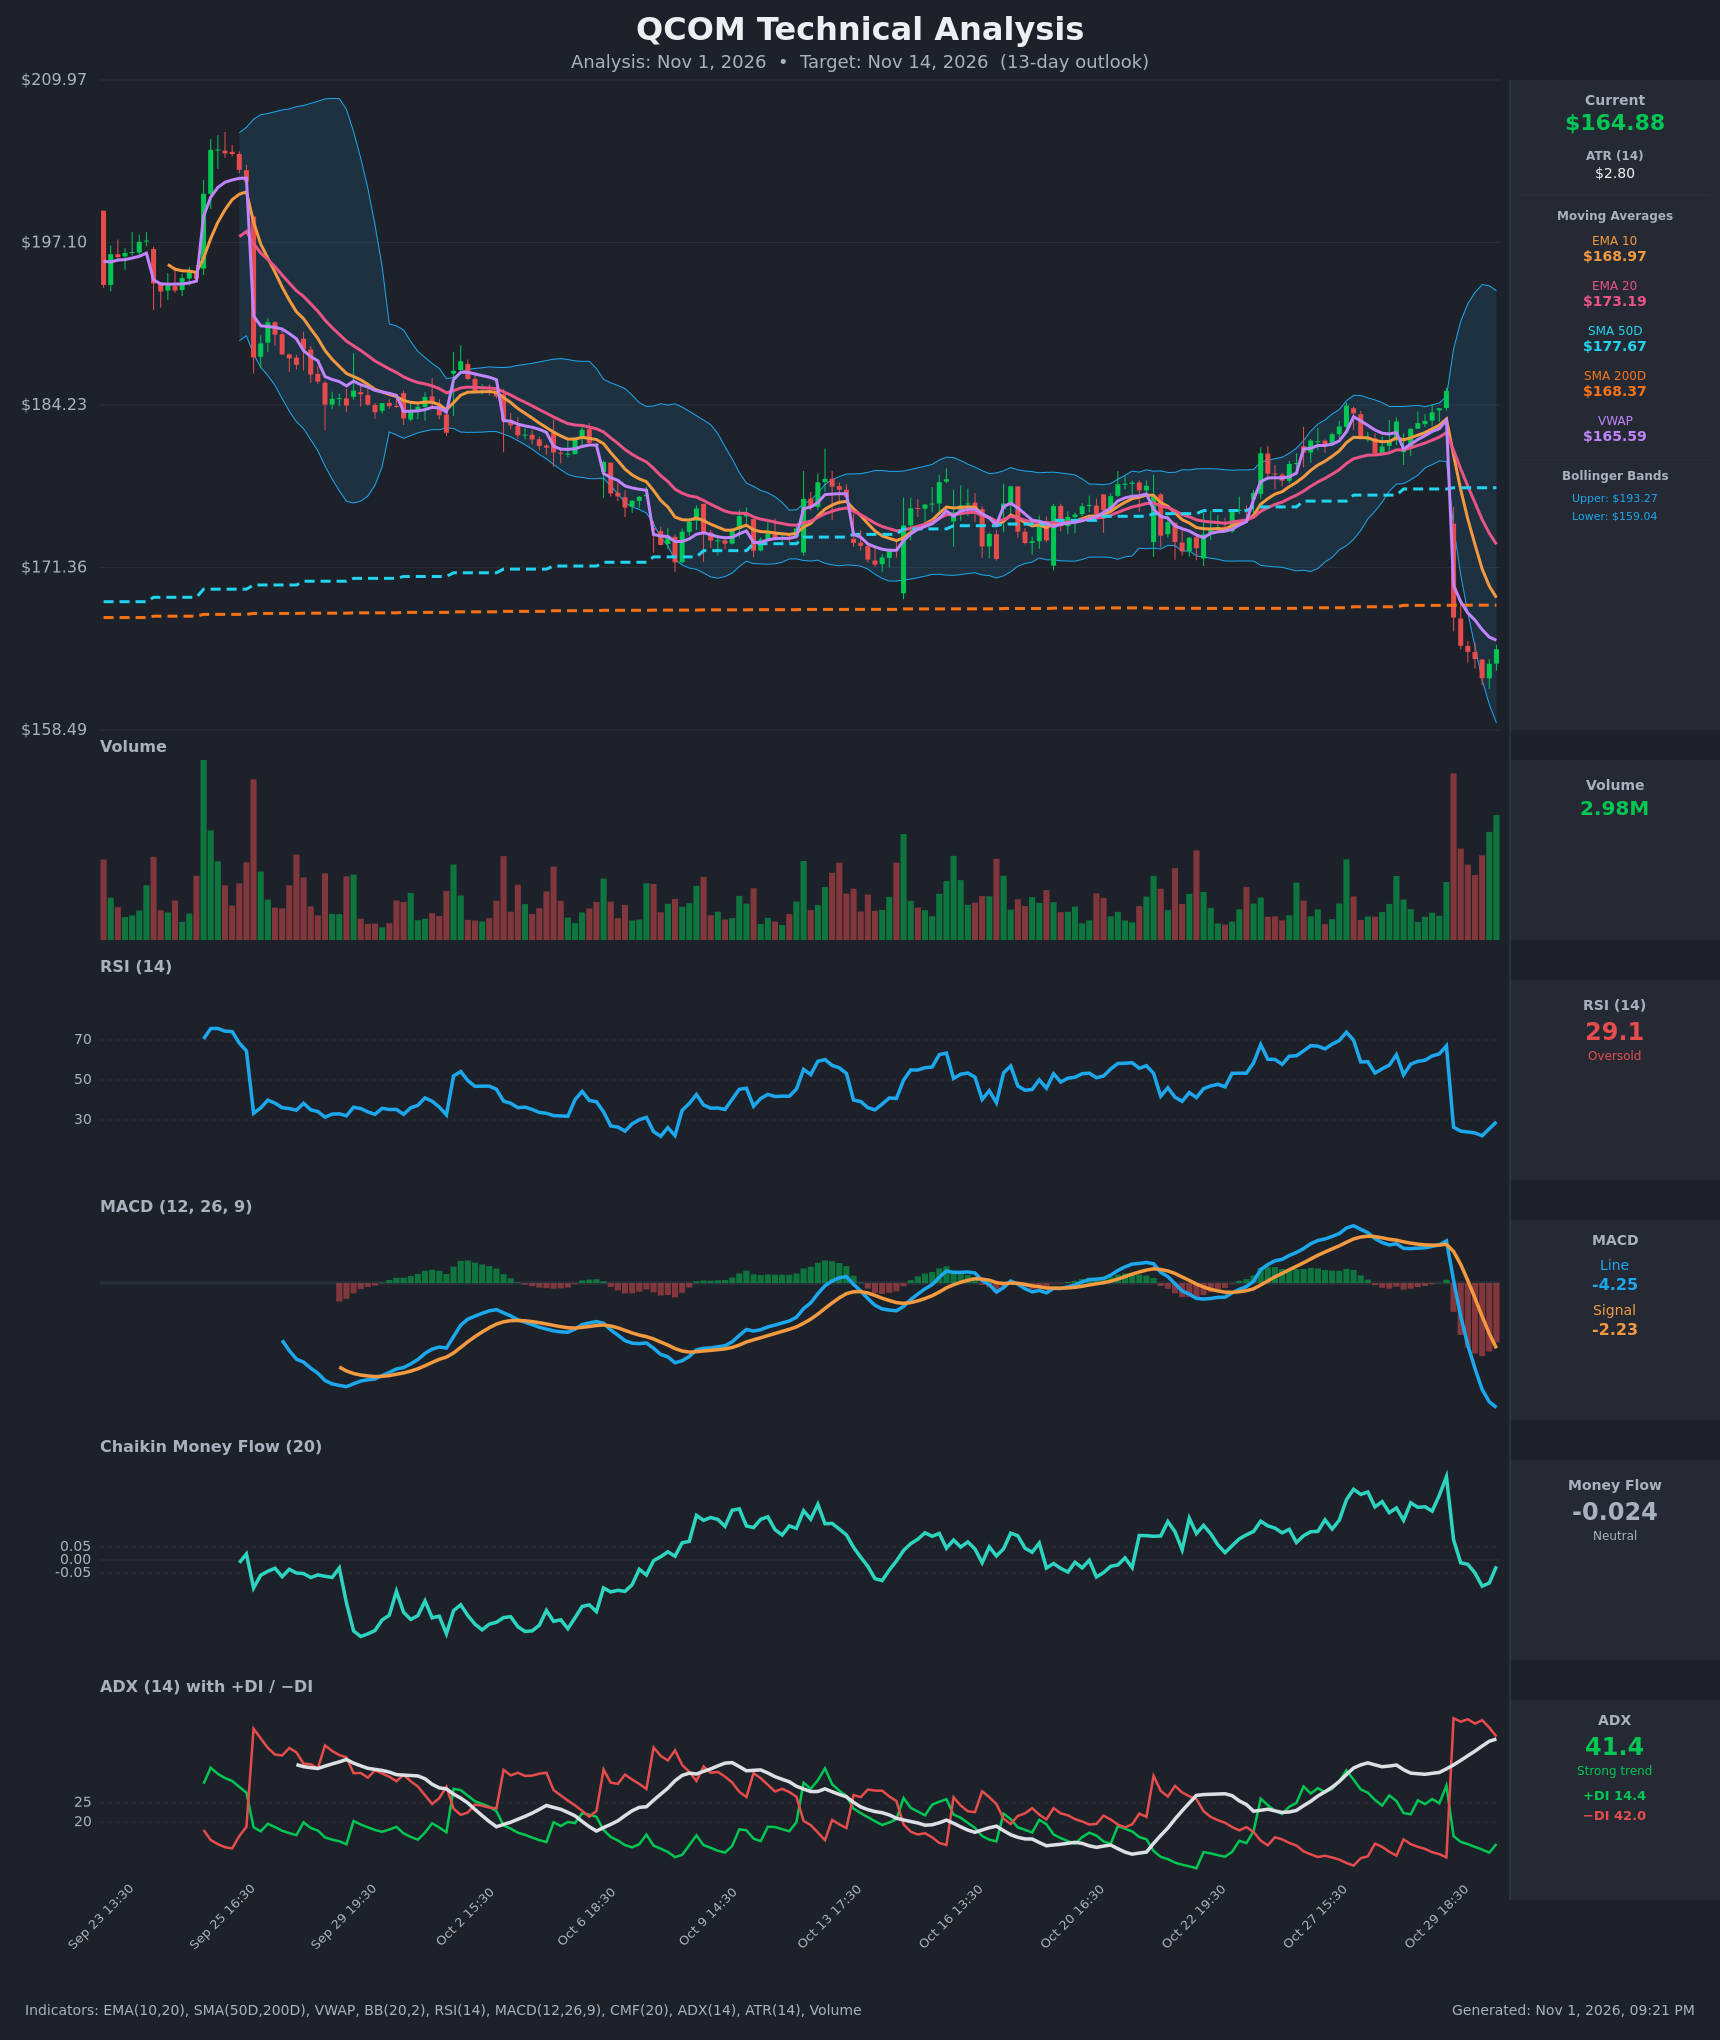
- RSI (14): 29.08, recovering slightly from a low of 22.1 after the earnings-style gap down from $185.34 to $167.40. It is oversold but has not turned up with any force. Oversold readings during a strong downtrend often stay depressed. [Bearish]
- 20 EMA: $173.19. Price at $164.88 sits about 5% below it, and EMA10 ($168.97) has been below EMA20 since the Oct 30 open (a bearish crossover). The EMA is falling steeply and acts as overhead resistance. [Bearish]
- MACD: Line -4.25 is below signal -2.23 and the gap is widening. The bearish crossover came on Oct 30 14:30, and the histogram is deeply negative and still expanding. [Bearish]
- Bollinger Bands (20): Upper $193.27, lower $159.04. Bands are widened by the gap, and price is in the lower quarter of the range, about $6 above the lower band. The middle band (~$176) is far overhead. It is not yet a "walk the band" extreme, but selling pressure is clear. [Bearish]
- CMF (20): -0.024, neutral by the ±0.05 threshold. It collapsed from +0.32 before the gap, so accumulation has been erased, and it is only slightly ticking up on the latest bar. [Neutral]
- ADX (14): 41.4 and rising, a strong trend, with −DI (42.0) far above +DI (14.4). The DI spread is huge, so bears are in firm control. [Strong Trend – Bearish]
- Volume: 2.98M on the latest bar, up from the previous few bars, with a huge volume spike on the gap-down day. The last bar is green on higher volume, which may be early dip-buying or capitulation, but it is not yet confirmed as a reversal. [Heavy distribution on the gap; tentative buying]
Other levels:
- VWAP: $165.59, with price just below it. This is slightly bearish.
- SMA200D: $168.37, now overhead after price broke below it.
- SMA50D: $177.67. There is no death cross, but SMA50 is above price, so rallies face stacked resistance.
DIVERGENCES & TRENDS
- There is no bullish RSI divergence yet. RSI made a fresh low (22.1) with the price low ($162.58), and the bounce to 29 is only a first uptick.
- MACD is accelerating downward with no sign of flattening, which confirms momentum rather than diverging from it.
- CMF fell from about +0.32 to -0.02 in a few bars, showing a sharp shift from buying to selling.
- ADX has been climbing from ~20 to 41 with −DI dominant, so the trend strengthened on the downside.
- Bearish crossovers are confirmed for EMA10/EMA20 and MACD/signal. SMA50 is still above SMA200, so there is no death cross, but price has lost both the 20 EMA and the SMA200.
- Price broke down out of the multi-week $172–$185 range with a gap, which is an event-driven breakdown.
CHART PATTERNS
- The prior multi-week sideways structure between ~$172 and ~$185 resembles a rectangle/triple-top style range, and it resolved to the downside with a gap. That matches the bearish Triple Top breakdown on the reference diagram.
- The measured move from the ~$172 range floor is roughly $12–$13 (the range height), which points to about $159–$160. That coincides with the lower Bollinger Band at $159.04.
- If a weak bounce forms into the $168–$173 area on declining volume, it would resemble a Bearish Flag/Pennant, with a continuation lower as the expected outcome.
- Bullish case: a Falling Wedge-type reversal would need a close above the SMA200 ($168.37) and EMA10 ($168.97). That has not happened.
POTENTIAL SCENARIOS
- Scenario 1: Bearish Post-Gap Continuation — Price fails near the SMA200/EMA10 cluster, then drifts lower as ADX stays strong and −DI dominates. Trigger: rejection at $168–$169 or a break below the $162.58 low. Target: $159–$161, with a possible overshoot to $156. Invalidation: daily close above $173.19 (EMA20). (50% probability)
- Scenario 2: Bullish Oversold Relief Bounce — RSI near 29 and the latest green bar on rising volume spark a mean-reversion rally toward the overhead moving averages. Trigger: close above $168.97 with volume. Target: $172–$174 (EMA20 and gap area). Invalidation: failure at $168 and a loss of $162.58. (30% probability)
- Scenario 3: Neutral Base-Building — Price stabilizes after the shock and chops between the lower band and the SMA200. Trigger: ADX rolls over with RSI holding at 30–40. Target: $160–$168 range. Invalidation: a decisive break of either $159 or $169. (20% probability)
PRICE TARGETS
- Target Price: $161.50 (13-day)
- Expected Range: $155.50 to $170.50 (width $15.00, about 9.1% of the current price, scaled for a 13-day horizon)
- Key Levels: Support at $159.04, Resistance at $168.37
OVERALL BIAS
OVERALL BIAS: BEARISH - Price is below the 10/20 EMAs and the SMA200 with a bearish MACD crossover, a strong ADX (41) and −DI far above +DI, and the breakdown from the multi-week range projects toward about $159–$161. Oversold RSI raises the risk of a relief bounce, but overhead resistance at $168–$173 should cap it.
This is educational analysis and not financial advice.