SMCI 13-day bullish forecast — Nov 1, 2026
- Bias: Bullish
- Timeframe: 13 days (made Nov 1, 2026, target date Nov 13, 2026)
- Price at analysis: $32.95
- Price target: $33.80
- Expected range: $31.60 – $34.80
- Result: Incorrect (-18.5%) — closed at $26.86 on Nov 13, 2026; quality score 0/100
Get a free AI analysis of SMCI today
Analysis
TECHNICAL INDICATORS
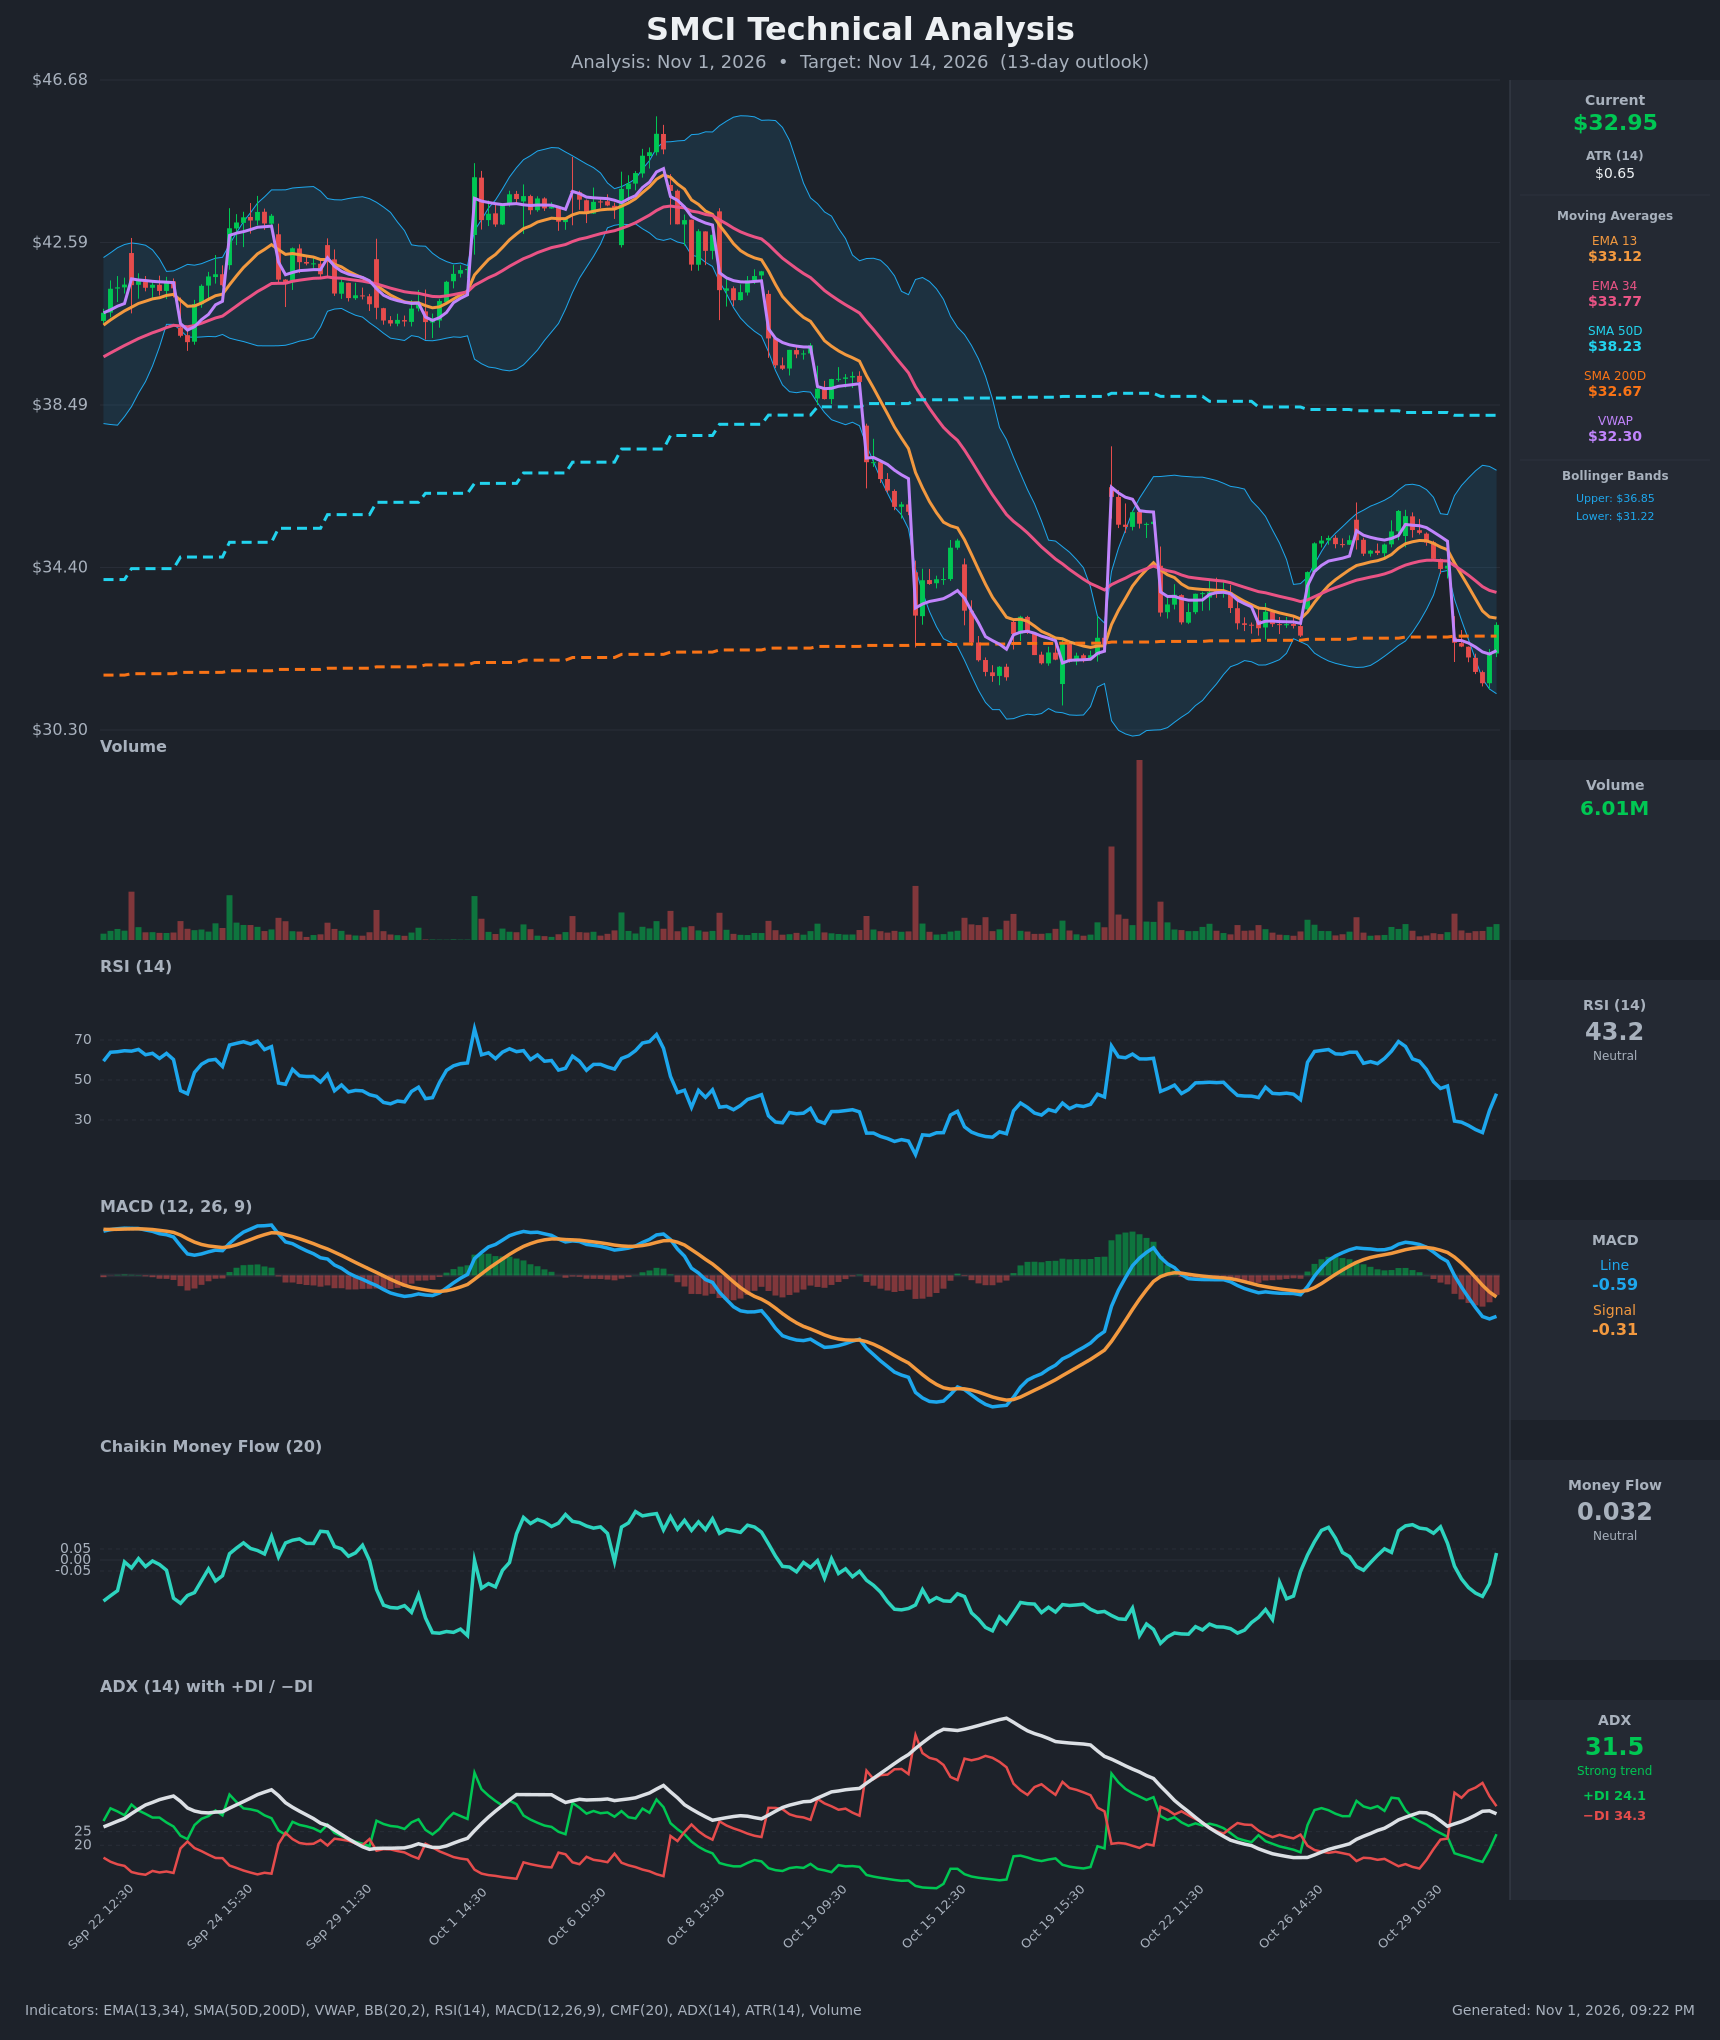
- RSI (14): 43.15, up sharply from an oversold 23.7 two bars ago. It is still below 50, so momentum is recovering but not yet bullish. The Oct 30 low (RSI ~24) was slightly higher than the mid-October trough (~20), which is a mild positive. [Neutral]
- 20 EMA: The provided short-term averages are EMA 13 at $33.12 and EMA 34 at $33.77, and price at $32.95 is below both. EMA13 is under EMA34 and both are sloping down, so they act as overhead resistance. [Bearish]
- MACD: The line is -0.59 and the signal is -0.31. The bearish crossover happened Oct 30 and the histogram is negative. The line is flattening (-0.626 → -0.589), which hints at downside momentum fading. [Bearish]
- Bollinger Bands (20): Upper is $36.85, lower is $31.22 and the midline is about $34.03. Price touched the lower band area ($31.48 low) and bounced back to the lower half of the bands. The midline is a natural mean-reversion target, but the bands are wide, so volatility is elevated. [Neutral]
- CMF (20): +0.032 sits inside the ±0.05 neutral zone. It turned up from -0.166, so selling pressure has eased, but accumulation is not confirmed. [Neutral]
- ADX (14): 31.5 with −DI at 34.3 above +DI at 24.1. This is a strong trend with bears in control. ADX is peaking and rolling over, and −DI is falling while +DI rises, so the bearish trend is losing steam. [Strong Trend – Bearish, weakening]
- Volume: The latest bar was 6.01M and green, on an upturn from the low. Selling volume on the Oct 30 gap-down was not capitulation-sized compared with the mid-October spikes. Volume gives no strong confirmation either way. [Neutral / slightly supportive of the bounce]
- Other levels: Price is above VWAP ($32.30) and just above SMA200 ($32.67), which is a long-term support test. It is far below SMA50 ($38.23), which is falling and well above price. [Mixed]
DIVERGENCES & TRENDS
- The RSI low on Oct 30 (~24) was slightly above the mid-October low (~20) while price made a similar low (~$31.5 vs ~$31.2). This is a mild bullish divergence or double-bottom-type structure.
- The MACD line is curling up while still below the signal, so a bullish cross is not yet in place. Momentum is improving but not confirmed.
- The ADX is peaking at ~32 with −DI declining and +DI rising. A +DI/−DI crossover has not occurred.
- The Oct 30 gap-down (from $34.44 to $32.50) left an unfilled gap that acts as a magnet and as resistance.
- EMA13 < EMA34 and price < SMA50 confirm the intermediate downtrend. SMA200 has held as support on both tests.
CHART PATTERNS
- Bullish Double Bottom (potential): Lows at ~$31.2 (mid-Oct) and ~$31.48 (Oct 30), both near the SMA200 zone. The neckline is around $34.4–$35.0 (the gap and the rally peak). A close above it would project toward ~$37, but that is beyond the 13-day horizon.
- Descending channel / bearish continuation risk: Lower highs from $36+ to ~$35.8 and lower lows overall. A failure at EMA13/EMA34 and a break below $31.48 would invalidate the double bottom and open a measured move toward $29–$30.
- The base case is a rebound toward the gap and Bollinger midline, not a full reversal.
POTENTIAL SCENARIOS
- Scenario 1: Bullish Double-Bottom Rebound — Price holds SMA200 and the Oct 30 low, then grinds up through the EMAs toward the Bollinger midline and the gap. Trigger: a close above EMA34 ($33.77) with MACD histogram turning positive and +DI crossing above −DI. Target: $33.80–$34.40. Invalidation: a daily close below $31.48. (45% probability)
- Scenario 2: Bearish Trend Resumption — The bounce fails at EMA13/EMA34, then price loses the SMA200 and retests or breaks the lows. Trigger: rejection at $33.10–$33.80 and a close below $32.67 with CMF going negative. Target: $31.20, then $30.30. Invalidation: a close above $34.40. (35% probability)
- Scenario 3: Neutral Chop Around the SMA200 — Price oscillates between $32 and $34 as ADX cools. Trigger: failure to break either EMA34 or $31.48. Target: $32.50–$33.50. Invalidation: a close beyond either $31.40 or $34.50. (20% probability)
PRICE TARGETS
- Target Price: $33.80 (13-day horizon, Nov 14)
- Expected Range: $31.60 to $34.80 (width $3.20, about 9.7% of current price, in line with the 8–12% guidance for ~2 weeks)
- Key Levels: Support at $32.67 (SMA200; secondary support at $31.48), Resistance at $34.40 (gap top and Bollinger midline zone; interim resistance at $33.77 EMA34)
OVERALL BIAS
OVERALL BIAS: BULLISH - Price bounced from the lower Bollinger Band at the SMA200 and the prior low. RSI is recovering from oversold with a mild divergence, CMF has turned positive, and the gap and Bollinger midline act as a magnet. The trend indicators (MACD, −DI, EMAs) remain bearish, so conviction is modest and a rejection at $33.1–$33.8 would flip the outlook.
This is educational analysis and not financial advice.