BB 20-day bearish forecast — Nov 1, 2026
- Bias: Bearish
- Timeframe: 20 days (made Nov 1, 2026, target date Nov 20, 2026)
- Price at analysis: $8.42
- Price target: $8.10
- Expected range: $7.60 – $8.60
- Result: Pending — graded after the close on Nov 20, 2026
Get a free AI analysis of BB today
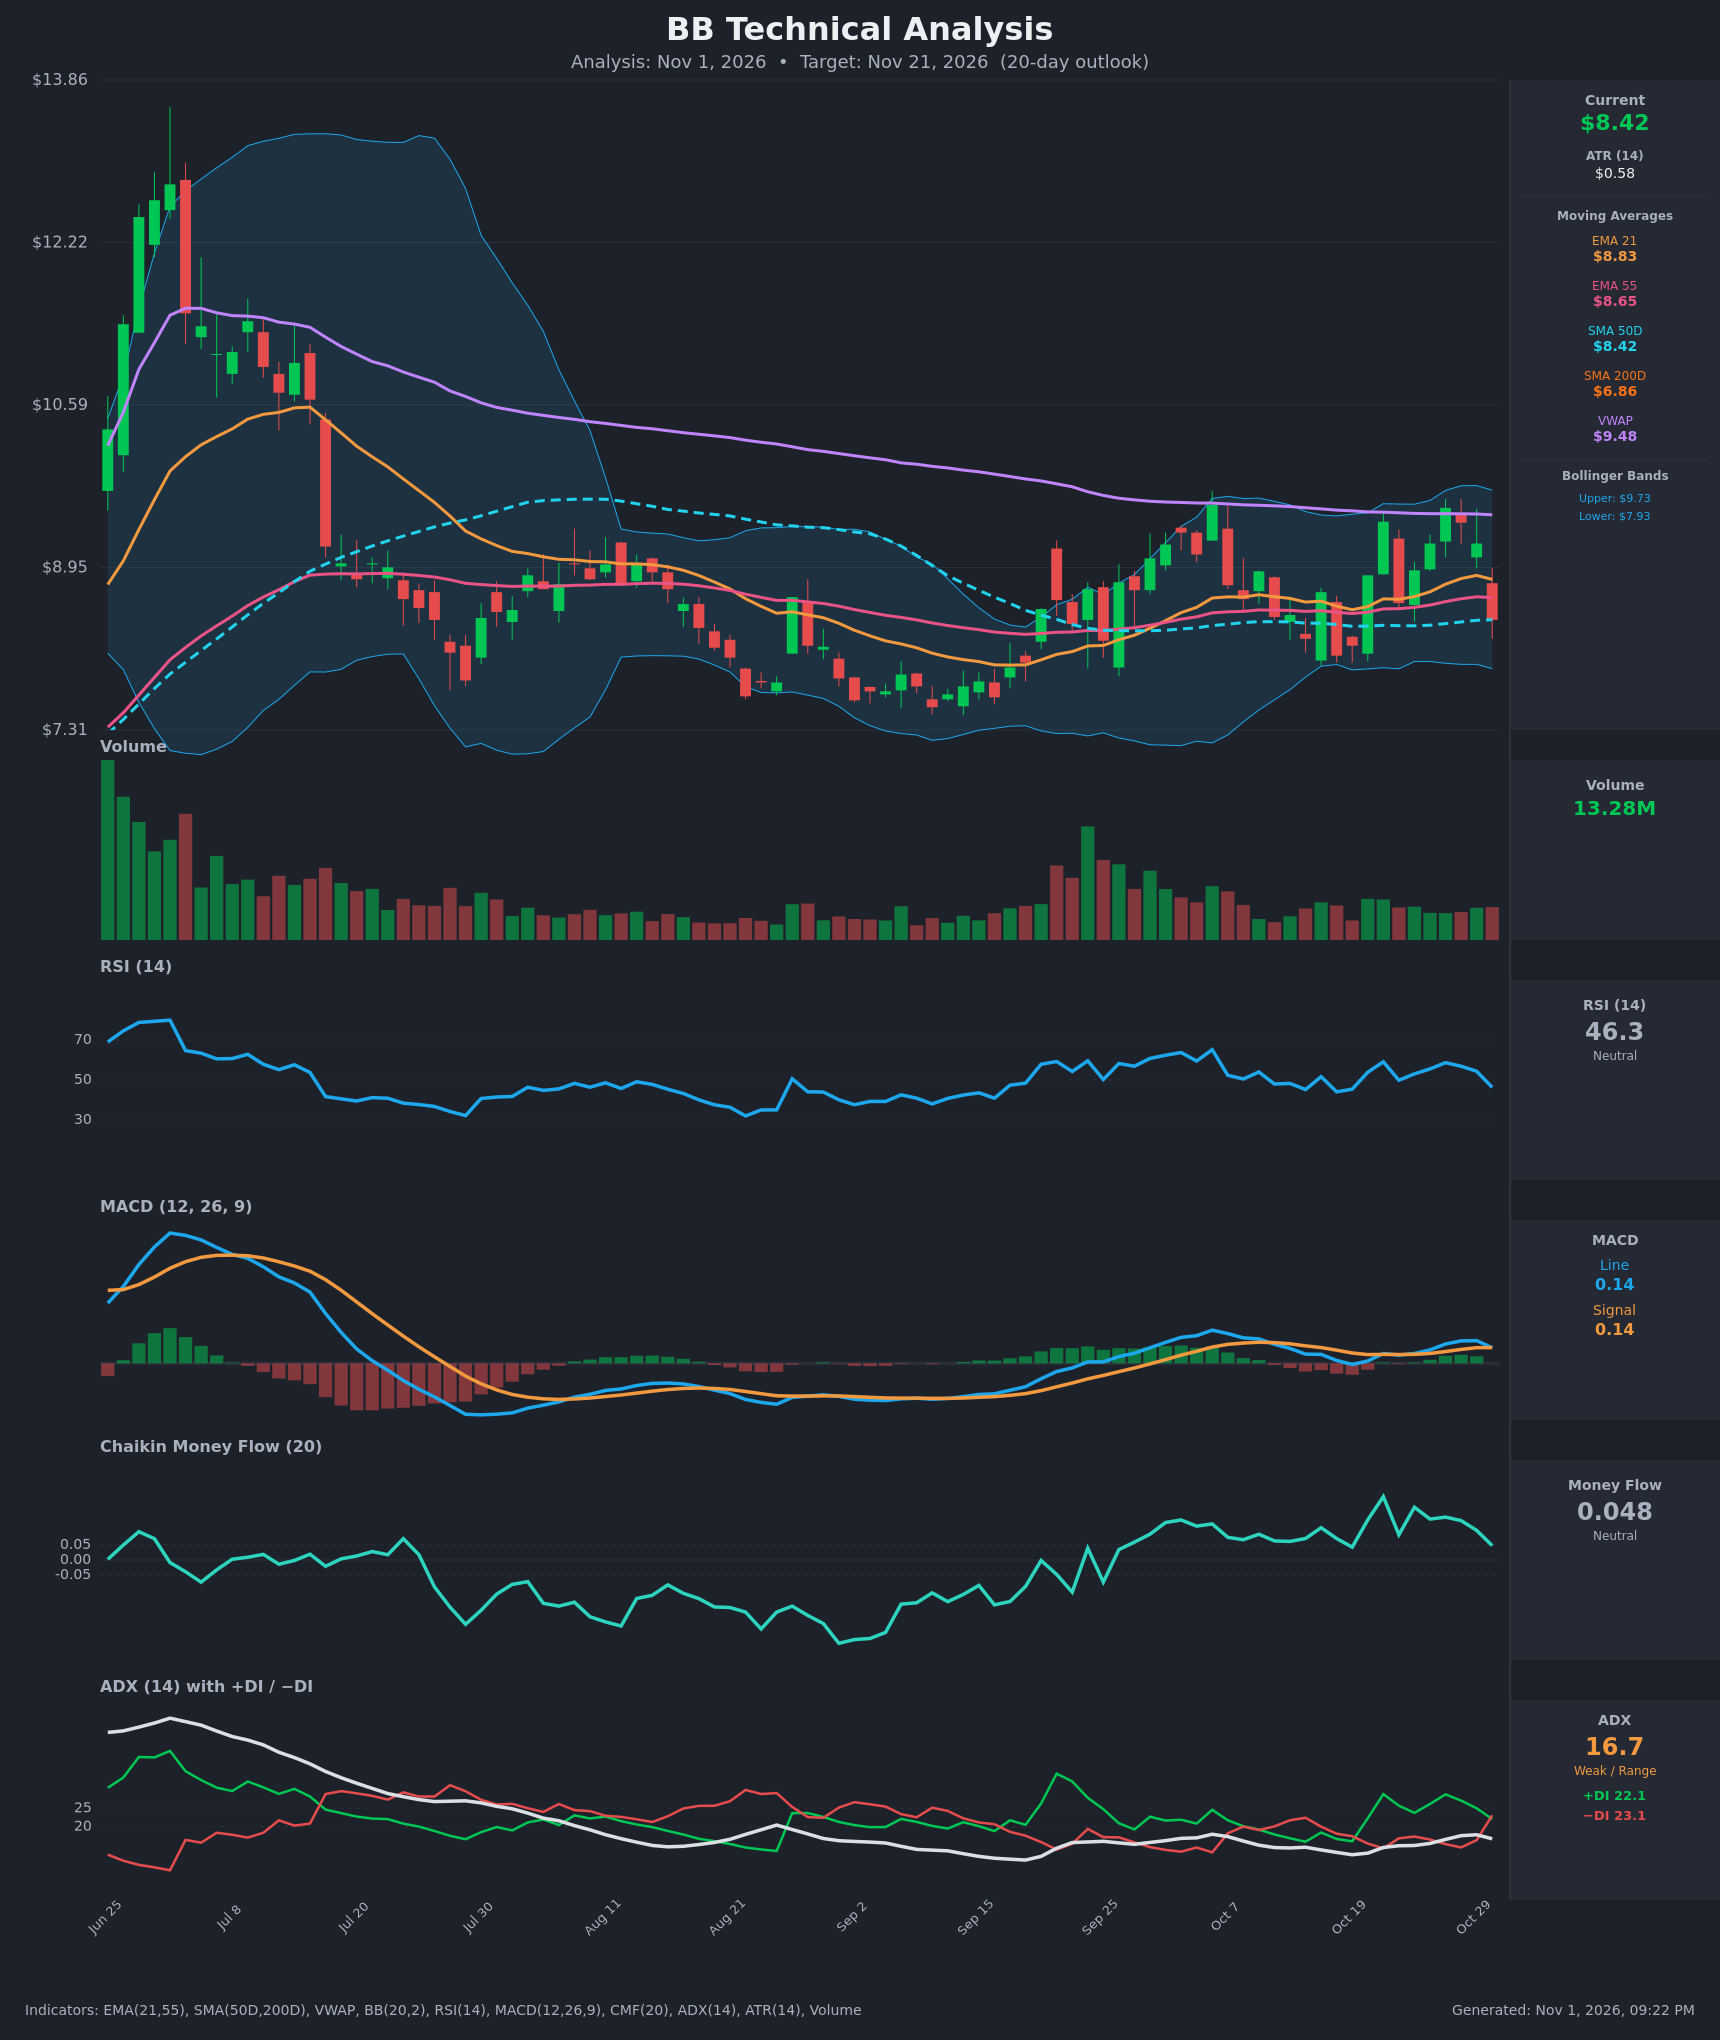
Analysis
TECHNICAL INDICATORS
- RSI (14): 46.29, down from 54.4 two sessions ago and from 58.7 on Oct 27. It has slipped back below the 50 midline after failing to approach 70, so momentum is fading but not oversold. [Bearish]
- 20 EMA (EMA 21 = $8.83): Price at $8.42 closed below the EMA 21 after a one-day drop of about 8%. EMA 21 is now overhead resistance. The EMA 55 at $8.65 is also above price, and the EMA 21 sits above the EMA 55, so there is no bearish EMA cross yet. [Bearish]
- MACD: Line 0.1369 and signal 0.1373, so the line has just rolled over into the signal line after peaking at 0.199 on Oct 29. The histogram has fallen to about zero from its recent positive peak. A bearish cross is imminent, and the line is only slightly above zero. [Bearish]
- Bollinger Bands (20): Upper $9.73, lower $7.93, with the midline near $8.83. Price has dropped from the upper half of the bands (rejection near the $9.5–9.7 area) to below the midline. The bands are fairly tight, so volatility is compressed. The next band support is $7.93. [Bearish]
- CMF (20): 0.048, down from 0.210 on Oct 21 and 0.098 on Oct 29. It is now just under the +0.05 accumulation threshold. Buying pressure is fading, but there is no distribution yet. [Neutral]
- ADX (14): 16.7, below 20, so the trend is weak and range-bound. −DI (23.1) has crossed back above +DI (22.1), a slight bearish tilt. The weak ADX means conviction is modest. [Weak Trend, bearish tilt]
- Volume: 13.28M on the sell-off bar, which is average to slightly above recent sessions. The red candle came on decent volume after a failed push to $9.55, which points to supply near the highs. Volume was far lower in the recent rally than during the Sep 20–25 surge. [Mildly Bearish]
Other moving averages and the long-term trend:
- Price sits at the SMA50D ($8.42), which is flat and acting as the pivot.
- Price is well above the SMA200D ($6.86), so the long-term structure is still constructive.
- Price is far below VWAP ($9.48), which has been a ceiling since June and capped the recent rally.
DIVERGENCES & TRENDS
- No major divergence. The Oct 27 high of $9.55 was confirmed by RSI (58.7) and MACD (0.17), but both peaked and rolled over quickly, which signals a short-lived rally rather than a trend change.
- Momentum rollover: MACD fell from 0.199 to 0.137 in two sessions and sits on the signal line. RSI dropped about 8 points in one day. CMF also faded from 0.21 to 0.048.
- DI crossover: −DI crossed back above +DI (23.1 vs 22.1) after bulls had held control from Oct 20–29. ADX is still below 20, so this is not yet a trend signal.
- MA structure: Price has lost the EMA 21 and EMA 55 and is sitting on the flat SMA50D. A close below it would confirm the failed breakout.
- Longer trend: The chart shows a base from late Aug to early Oct, a rally to the VWAP and upper band, and now a rejection. This is a range of roughly $7.90–$9.55.
CHART PATTERNS
- Bearish Double Top (reference diagram): Peaks at $9.41 (Oct 21) and $9.55 (Oct 27) formed near the VWAP and the upper Bollinger Band. The neckline sits around $8.06–$8.59, with the intermediate trough at $8.59 and the last bar closing back near the neckline. A confirmed break below roughly $8.06 would project a measured move of about $1.0 lower (toward $7.5), but that would need to overcome the SMA50D and lower-band support. This is a tentative pattern, since the two peaks are only marginally different and sit within a wider range.
- Broader range: The chart shows a sideways range between $7.9 and $9.6 with a weak ADX. That limits the downside to the $7.9 lower band unless the neckline fails.
- Bullish context: The base above the rising SMA200D and the Sep rally are constructive, so a failed double top that reclaims $8.83 would be bullish.
POTENTIAL SCENARIOS
- Scenario 1: Bearish Double-Top Rejection — Price fails to reclaim the EMA 21, MACD crosses down, and −DI stays on top. The pullback extends to the neckline and the lower Bollinger Band. Trigger: daily close below the SMA50D ($8.42) and then below $8.20. Target: $8.10 as the 20-day target, with a stretch to $7.90–$8.00 near the lower band. Invalidation: daily close above $8.83 (EMA 21) with MACD turning back up. (50% probability)
- Scenario 2: Neutral Range Chop — Price oscillates around the flat SMA50D, between the $7.93 lower band and the $8.83 EMA 21, with ADX staying below 20. Trigger: no clean break of $8.06 or $8.83. Target: $8.30–$8.50 at the end of the window. Invalidation: close outside the $7.93–$8.83 band. (28% probability)
- Scenario 3: Bullish Failed Breakdown — Buyers defend the SMA50D and rising CMF pushes price back through the EMA 21, retesting the VWAP and upper band. Trigger: close above $8.83 on rising volume. Target: $9.30–$9.50. Invalidation: close back below $8.40. (22% probability)
PRICE TARGETS
- Target Price: $8.10 (20-day horizon)
- Expected Range: $7.60 to $8.60 (width $1.00, about 11.9% of the current price, consistent with the 14–21 day guidance)
- Key Levels: Support at $8.06 (Oct 16 close and double-top neckline area, with the $7.93 lower band just beneath), Resistance at $8.83 (EMA 21)
OVERALL BIAS
OVERALL BIAS: BEARISH - Price was rejected near the VWAP and the upper Bollinger Band, then fell back below the EMA 21 and EMA 55 onto the flat SMA50D. MACD is on the verge of a bearish cross, RSI is back under 50, CMF is fading, and −DI has retaken the lead. A weak ADX (16.7) and the rising SMA200D below keep conviction modest, with the downside likely capped near $7.90–$8.10.
This is educational analysis and not financial advice.