IWM 20-day bearish forecast — Nov 1, 2026
- Bias: Bearish
- Timeframe: 20 days (made Nov 1, 2026, target date Nov 20, 2026)
- Price at analysis: $279.33
- Price target: $275.50
- Expected range: $263.50 – $289.00
- Result: Pending — graded after the close on Nov 20, 2026
Get a free AI analysis of IWM today
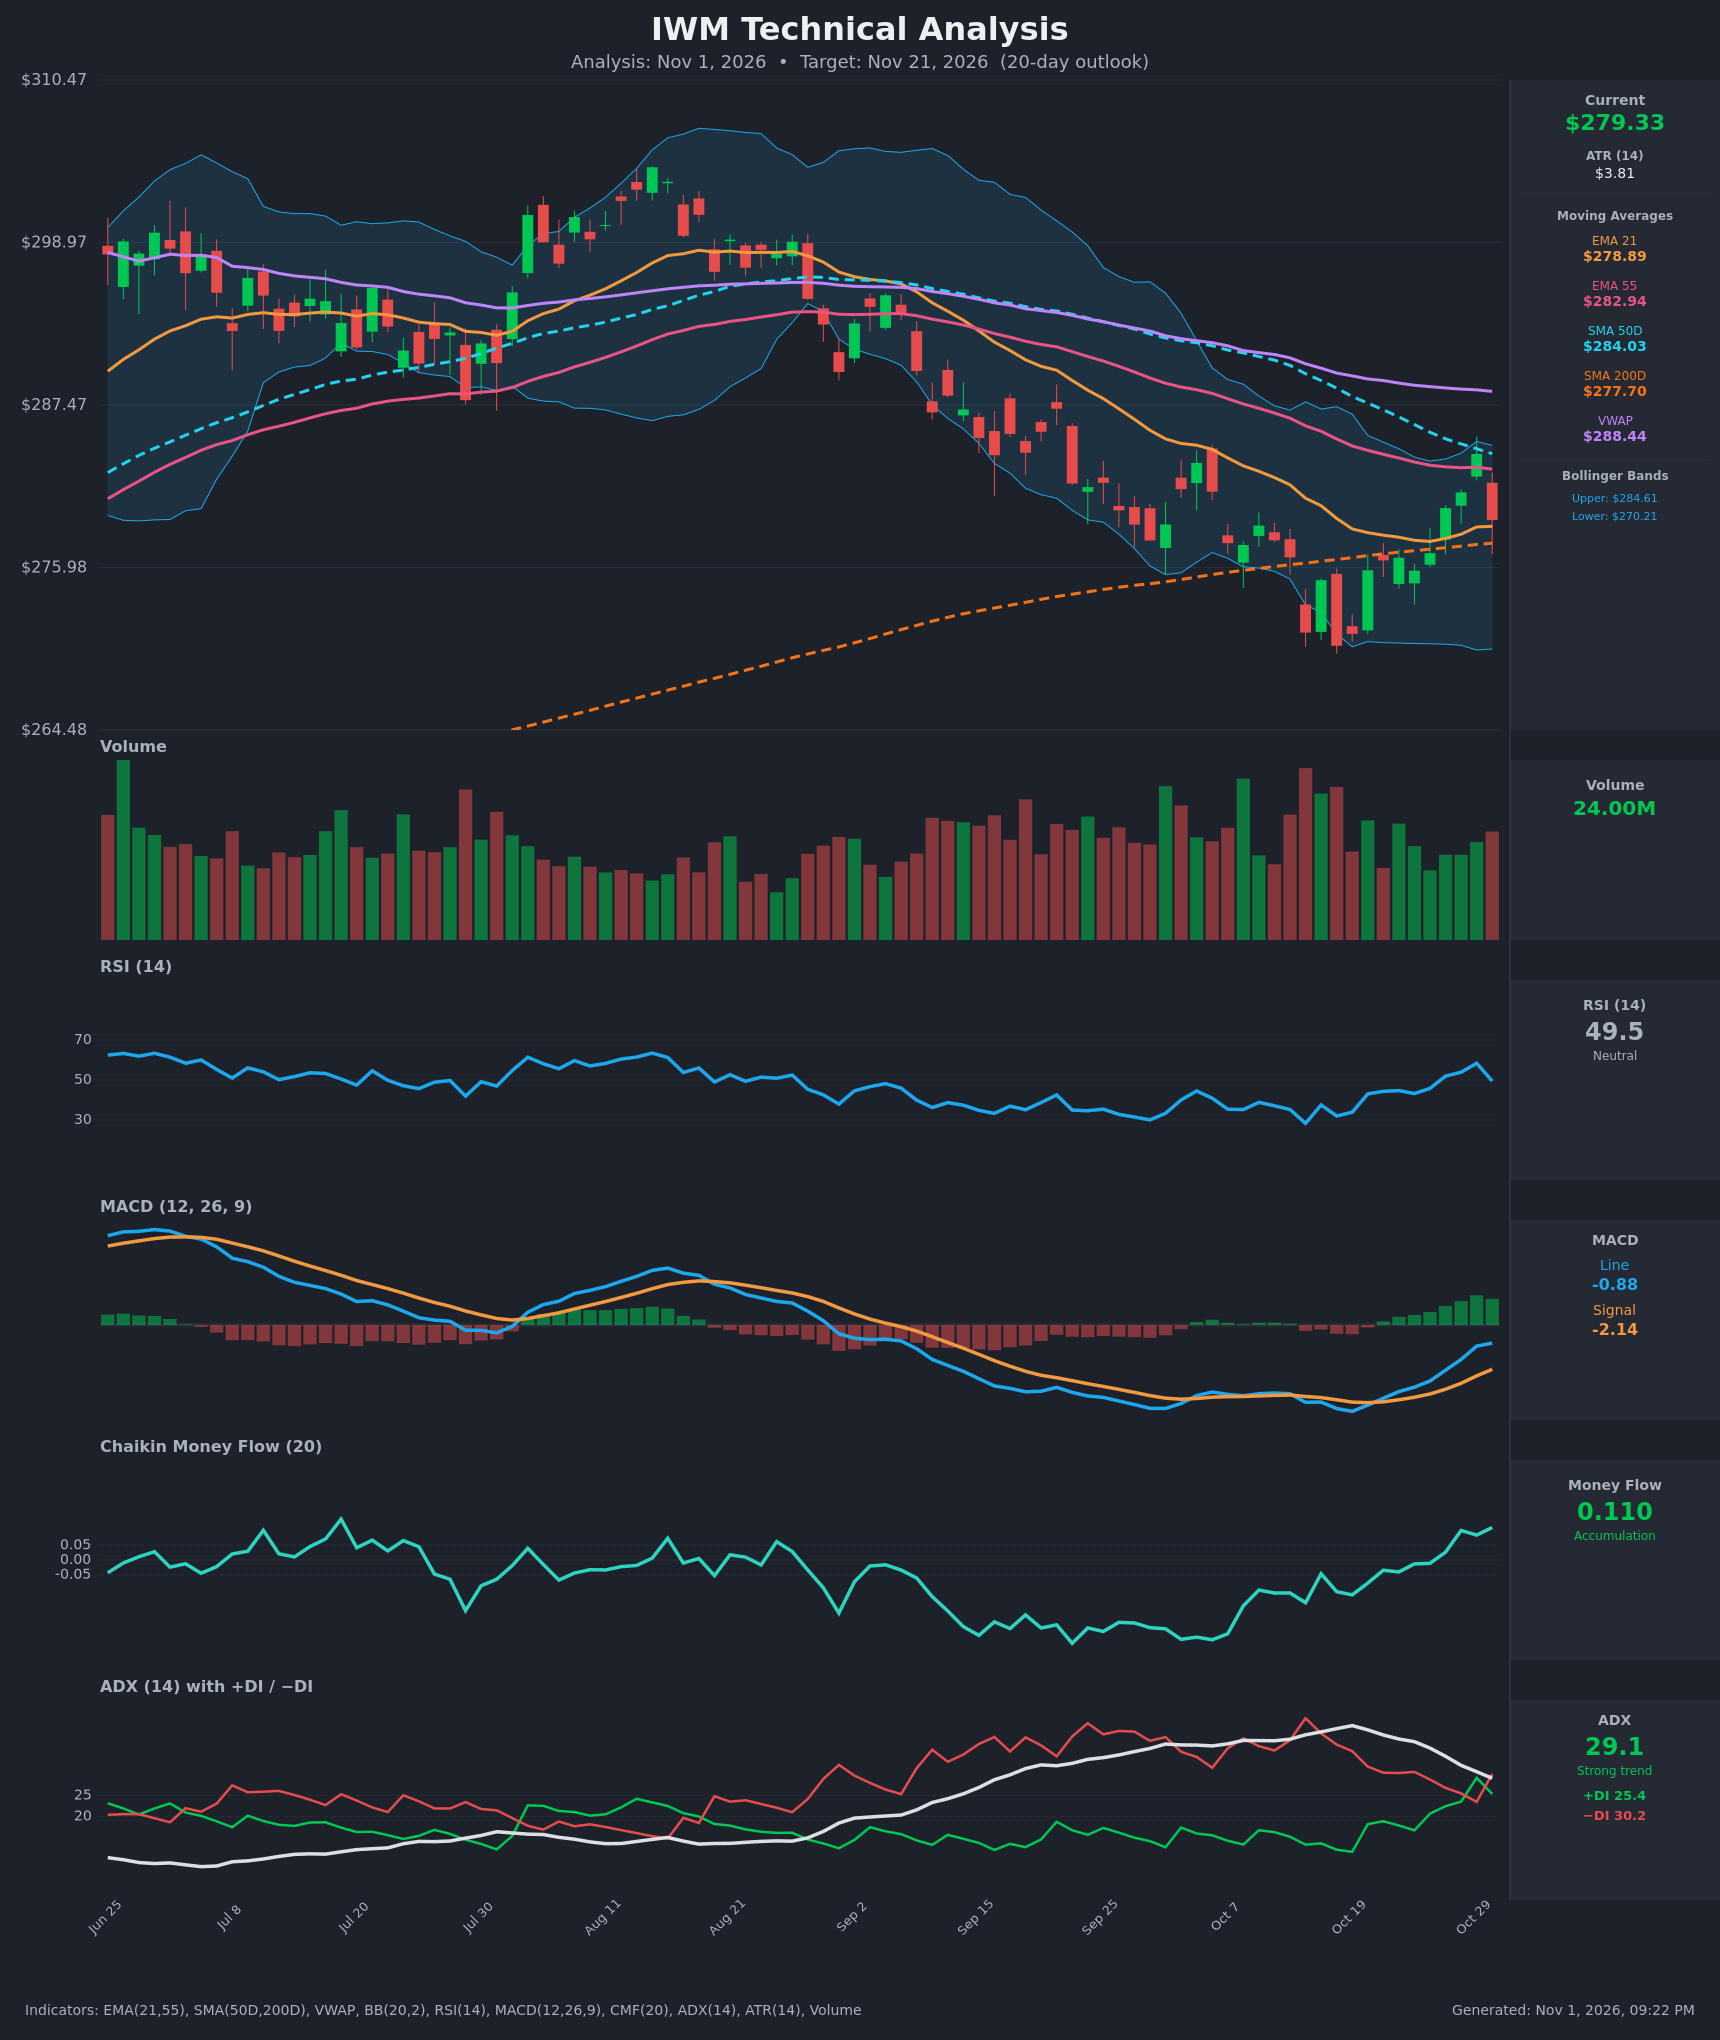
Analysis
TECHNICAL INDICATORS
- RSI (14): 49.48, down sharply from 58.4 on Oct 29 after recovering from the 28 oversold low on Oct 14. It is back at the midline, so the bounce's momentum has stalled. [Neutral]
- 20 EMA: The EMA 21 is $278.89 and price ($279.33) is barely above it, so it is thin support. The EMA 21 is still below the EMA 55 ($282.94), a bearish stack, with no bullish cross yet. [Neutral]
- MACD: The line (-0.875) has crossed above the signal (-2.139) and the histogram is positive and expanding. Both lines are still below zero, so this is a recovery from deeply negative momentum, not a confirmed trend change. [Bullish]
- Bollinger Bands (20): The bands run $270.21 to $284.61, with the midline near $277.4. Price tagged the upper band on Oct 29 ($284.01) and was rejected back toward the middle. The lower band was tested around Oct 14-16, so the range is roughly $270-$285. [Neutral]
- CMF (20): 0.110, positive for several sessions and above the +0.05 threshold. Buying pressure has improved noticeably from -0.145 on Oct 14, but the latest red candle came on solid volume. [Accumulation]
- ADX (14): 29.1 and falling from a peak of about 41. −DI (30.2) has crossed back above +DI (25.4) after +DI had briefly led. The downtrend is still intact but losing strength. [Strong Trend, Bearish]
- Volume: 24.00M on the Oct 30 red reversal bar, in line with or above the recent average. The selling into $284 resistance carried conviction, while the bounce itself came on mixed, unremarkable volume. [Bearish rejection]
DIVERGENCES & TRENDS
- MACD/RSI vs. price: The Oct 14-16 lows (~$268-$270) brought RSI to 28-32, with MACD histogram momentum fading. That produced a bullish momentum recovery, but RSI's failure to hold above 58 shows the rally lacked follow-through.
- CMF vs. price: CMF has made a clear higher low and is rising while price is still below the declining SMA50/VWAP. This is a mild bullish divergence, though the Oct 30 reversal weakens it.
- Moving averages: The SMA50D ($284.03) is falling toward the SMA200D ($277.70) and is on course for a death cross, a longer-term bearish signal. Price sits just above the SMA200D, which is a key pivot. VWAP ($288.44) is well overhead.
- Crossovers: The MACD bullish cross is recent. The DI flip back to −DI > +DI on Oct 30 is bearish. EMA21 < EMA55 remains.
- Resistance confluence: The Oct 29 high stalled at the EMA55 (~$283), SMA50 (~$284) and upper Bollinger Band (~$284.6). Price was rejected there with a -1.65% candle.
CHART PATTERNS
- Possible Bullish Double Bottom: The lows near $268-$270 (Oct 14-16) with a neckline around $284 fit this pattern. The pattern failed its first test, because the Oct 30 rejection came right at the neckline. A close above $285 would reactivate it, with a measured target of about $299-$300.
- Broader context: The August-October slide of lower highs and lower lows is a bearish downtrend. The current bounce looks like a retracement into declining resistance, closer to a Bearish Flag or Rising Wedge-type corrective bounce than a confirmed reversal.
- Bearish case: A break back below $277-$278 (SMA200 and EMA21) would confirm the failed bounce, with a measured move toward the prior lows at $268-$270 and possibly lower.
POTENTIAL SCENARIOS
- Scenario 1: Bearish Failed Bounce at Resistance — Price was rejected at the SMA50/EMA55/upper-band confluence, −DI has retaken control with ADX still near 29, and the SMA50 is heading toward a death cross. Price rolls over, loses the EMA21/SMA200 zone and drifts toward the lower half of the Bollinger range. Trigger: daily close below $277.70. Target: $270-$272, with an extension to $266. Invalidation: daily close above $285. (50% probability)
- Scenario 2: Bullish Double-Bottom Breakout — The MACD cross and positive CMF mark a base. Buyers defend the $277-$279 zone and push through $284-$285 with volume. Trigger: close above $285 on expanding volume. Target: $291 first, then $298-$300. Invalidation: close below $275. (33% probability)
- Scenario 3: Neutral Range Chop — Price oscillates between the SMA200 (~$277.7) and the SMA50 (~$284) as ADX continues to fade. Trigger: failure to break either $277 or $285 for most of the window. Target: $277-$283. Invalidation: a decisive close outside the $275-$286 range. (17% probability)
PRICE TARGETS
For a 20-day horizon (about 8-12% width guideline, roughly $22-$34):
- Target Price: $275.50
- Expected Range: $263.50 to $289.00 (width $25.50, about 9.1% of current price)
- Key Levels: Support at $277.70 (SMA200D), Resistance at $284.03 (SMA50D)
OVERALL BIAS
OVERALL BIAS: BEARISH - Price was rejected at a confluence of declining resistance ($283-$285), −DI has retaken control with ADX still near 29, RSI is rolling over from 58, and the SMA50 is converging toward a death cross. The MACD cross and positive CMF temper conviction, but the weight of evidence favors a retest of the $270s.
This is educational analysis and not financial advice.