QQQ 20-day bearish forecast — Nov 1, 2026
- Bias: Bearish
- Timeframe: 20 days (made Nov 1, 2026, target date Nov 20, 2026)
- Price at analysis: $690.49
- Price target: $672.00
- Expected range: $643.00 – $712.00
- Result: Pending — graded after the close on Nov 20, 2026
Get a free AI analysis of QQQ today
Analysis
TECHNICAL INDICATORS
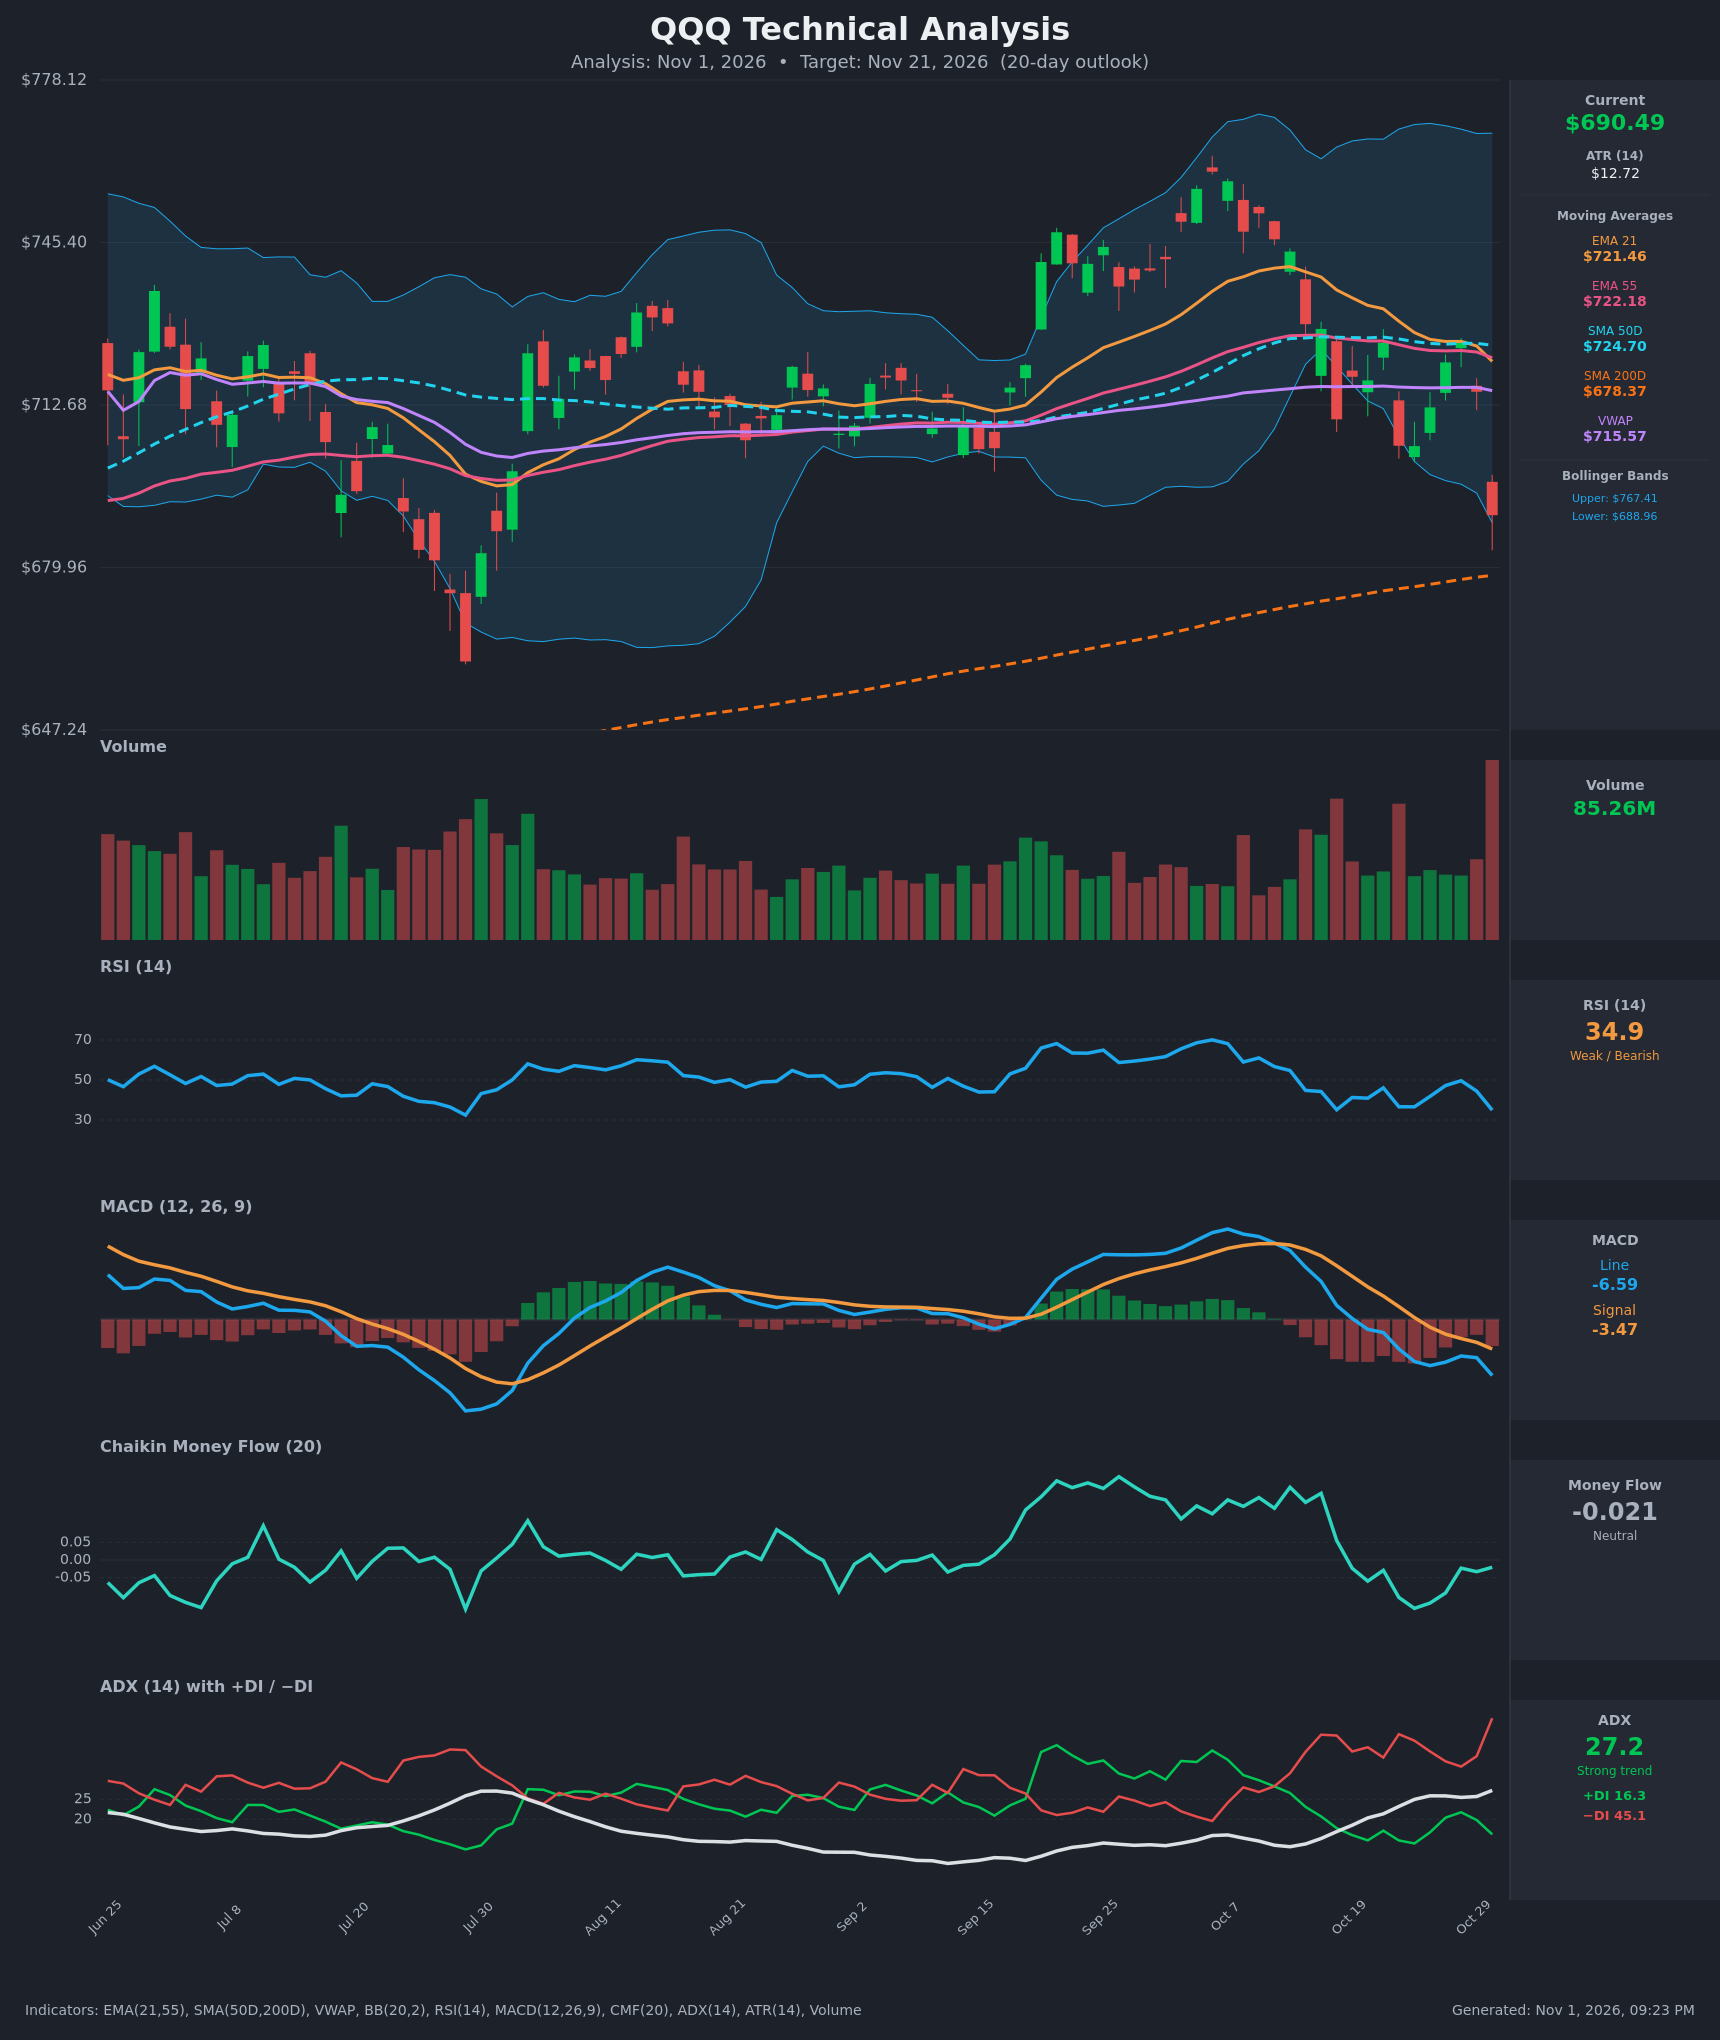
- RSI (14): 34.93, falling from 49.6 on Oct 28 and approaching oversold (<30) without reaching it. Momentum is clearly down, and the reading is still above the Jul 30 low of ~31. [Bearish]
- 20 EMA: The supplied value is the EMA 21 at $721.46. Price at $690.49 is about 4.3% below it. EMA21 has just crossed below EMA55 ($722.18), so the short-term average is now acting as overhead resistance. [Bearish]
- MACD: Line at -6.59 is below signal at -3.47, and the histogram is negative and widening. The bearish crossover happened around Oct 26, and the line is making new lows since the Sep/Oct peak. [Bearish]
- Bollinger Bands (20): Price at $690.49 sits just above the lower band ($688.96), with the upper band at $767.41. The bands are wide, so volatility is elevated. The latest candle is a large red bar pressing the lower band, which is a "walk the band" breakdown signal. A close below the band raises the odds of a continuation or a snap-back bounce. [Bearish]
- CMF (20): -0.021, inside the neutral zone. It has faded from +0.2 in mid-October and is hovering around zero to slightly negative, so buying pressure has dried up without strong distribution yet. [Neutral]
- ADX (14): 27.2 and rising, with -DI at 45.1 far above +DI at 16.3. This is a strong, established downtrend with bears firmly in control. [Strong Trend – Bearish]
- Volume: 85.26M, the highest bar on the chart, on a large red down candle. High-volume selling is a sign of distribution or capitulation-style participation. [Bearish – heavy-volume breakdown]
DIVERGENCES & TRENDS
- No bullish RSI/price divergence yet. RSI at 34.9 is making a lower low alongside price, which confirms the weakness (in contrast, Jul 30 had a deeper price low with only a modest RSI low).
- The MACD bearish crossover (~Oct 26) and the EMA21/EMA55 bearish cross are both confirmed. The SMA50D ($724.70) is still above the SMA200D ($678.37), so there is no death cross, but the 50D is flattening and rolling over.
- Price has lost the EMA21, EMA55, SMA50D and VWAP ($715.57) cluster at ~$715–725, which has become a thick resistance band.
- The next major support is the rising SMA200D at ~$678, only ~1.8% below. The Jul 30 low (~$655–660) is the major structural support below that.
- DI spread (-DI 45 vs +DI 16) is at a stretched extreme, which often precedes a short-term relief bounce even within a downtrend.
CHART PATTERNS
- The rally to the Oct 7 peak (~$755) followed by lower highs ($746 → $725 → $725) and a break below the $704 swing low suggests a Bearish Double Top / lower-high rollover from the reference diagram. The neckline is around $704–705, which has now been broken. Measured move: peak ~$755 minus neckline ~$704 = ~$51, pointing to ~$653, which lines up with the Jul 30 low zone.
- The ~$715–725 area was repeatedly retested as a bounce ceiling (Oct 21, Oct 28), and the failure there resembles a Bearish Flag / Pennant continuation within the downtrend.
- The SMA200D at ~$678 is likely to provide an interim bounce area before any measured-move extension.
POTENTIAL SCENARIOS
- Scenario 1: Bearish Continuation to SMA200D and Below — The double-top neckline break, widening MACD histogram, ADX >25 with -DI dominance and heavy-volume breakdown favor further downside, with a test of the rising SMA200D and possibly the Jul low zone. Trigger: daily close below $688 (the lower Bollinger Band) and below $678 (SMA200D). Target: $660–$670 (an extension to ~$653 is possible). Invalidation: daily close back above $715 (VWAP/EMA cluster). (50% probability)
- Scenario 2: Bearish-to-Neutral Oversold Bounce Then Fade — RSI near oversold and price at the lower band, with the SMA200D just below, can spark a relief rally toward the $705–$715 resistance before sellers return. Trigger: hold above $678 and reclaim $700. Target: $705–$715, then rollover to ~$685–$695 by day 20. Invalidation: close below $675. (30% probability)
- Scenario 3: Bullish Reversal / V-Recovery — Buyers defend the SMA200D, with the long-term uptrend intact and price reclaiming the EMA cluster. Trigger: close above $722 on rising volume. Target: $735–$745. Invalidation: failure at $715 or a close below $678. (20% probability)
PRICE TARGETS
- Target Price: $672.00 (20-day horizon, a modest further decline with an interim SMA200D test)
- Expected Range: $643.00 to $712.00 (width $69, ≈10.0% of current price, consistent with a 14–21 day horizon; the lower bound allows for an extension toward the measured-move area, the upper bound for a bounce into the VWAP/EMA cluster)
- Key Levels: Support at $678.00 (SMA200D), Resistance at $715.50 (VWAP/EMA cluster)
OVERALL BIAS
OVERALL BIAS: BEARISH - A heavy-volume breakdown below the neckline, a bearish MACD crossover and EMA21/55 cross, a strong ADX with -DI dominating, and price below every short-term average all favor further downside. The rising SMA200D (~$678) is a likely pause point, and an oversold bounce into $705–$715 is the main risk.
This is educational analysis and not financial advice.