SMCI 20-day bearish forecast — Nov 1, 2026
- Bias: Bearish
- Timeframe: 20 days (made Nov 1, 2026, target date Nov 20, 2026)
- Price at analysis: $32.95
- Price target: $30.80
- Expected range: $26.50 – $36.50
- Result: Pending — graded after the close on Nov 20, 2026
Get a free AI analysis of SMCI today
Analysis
TECHNICAL INDICATORS
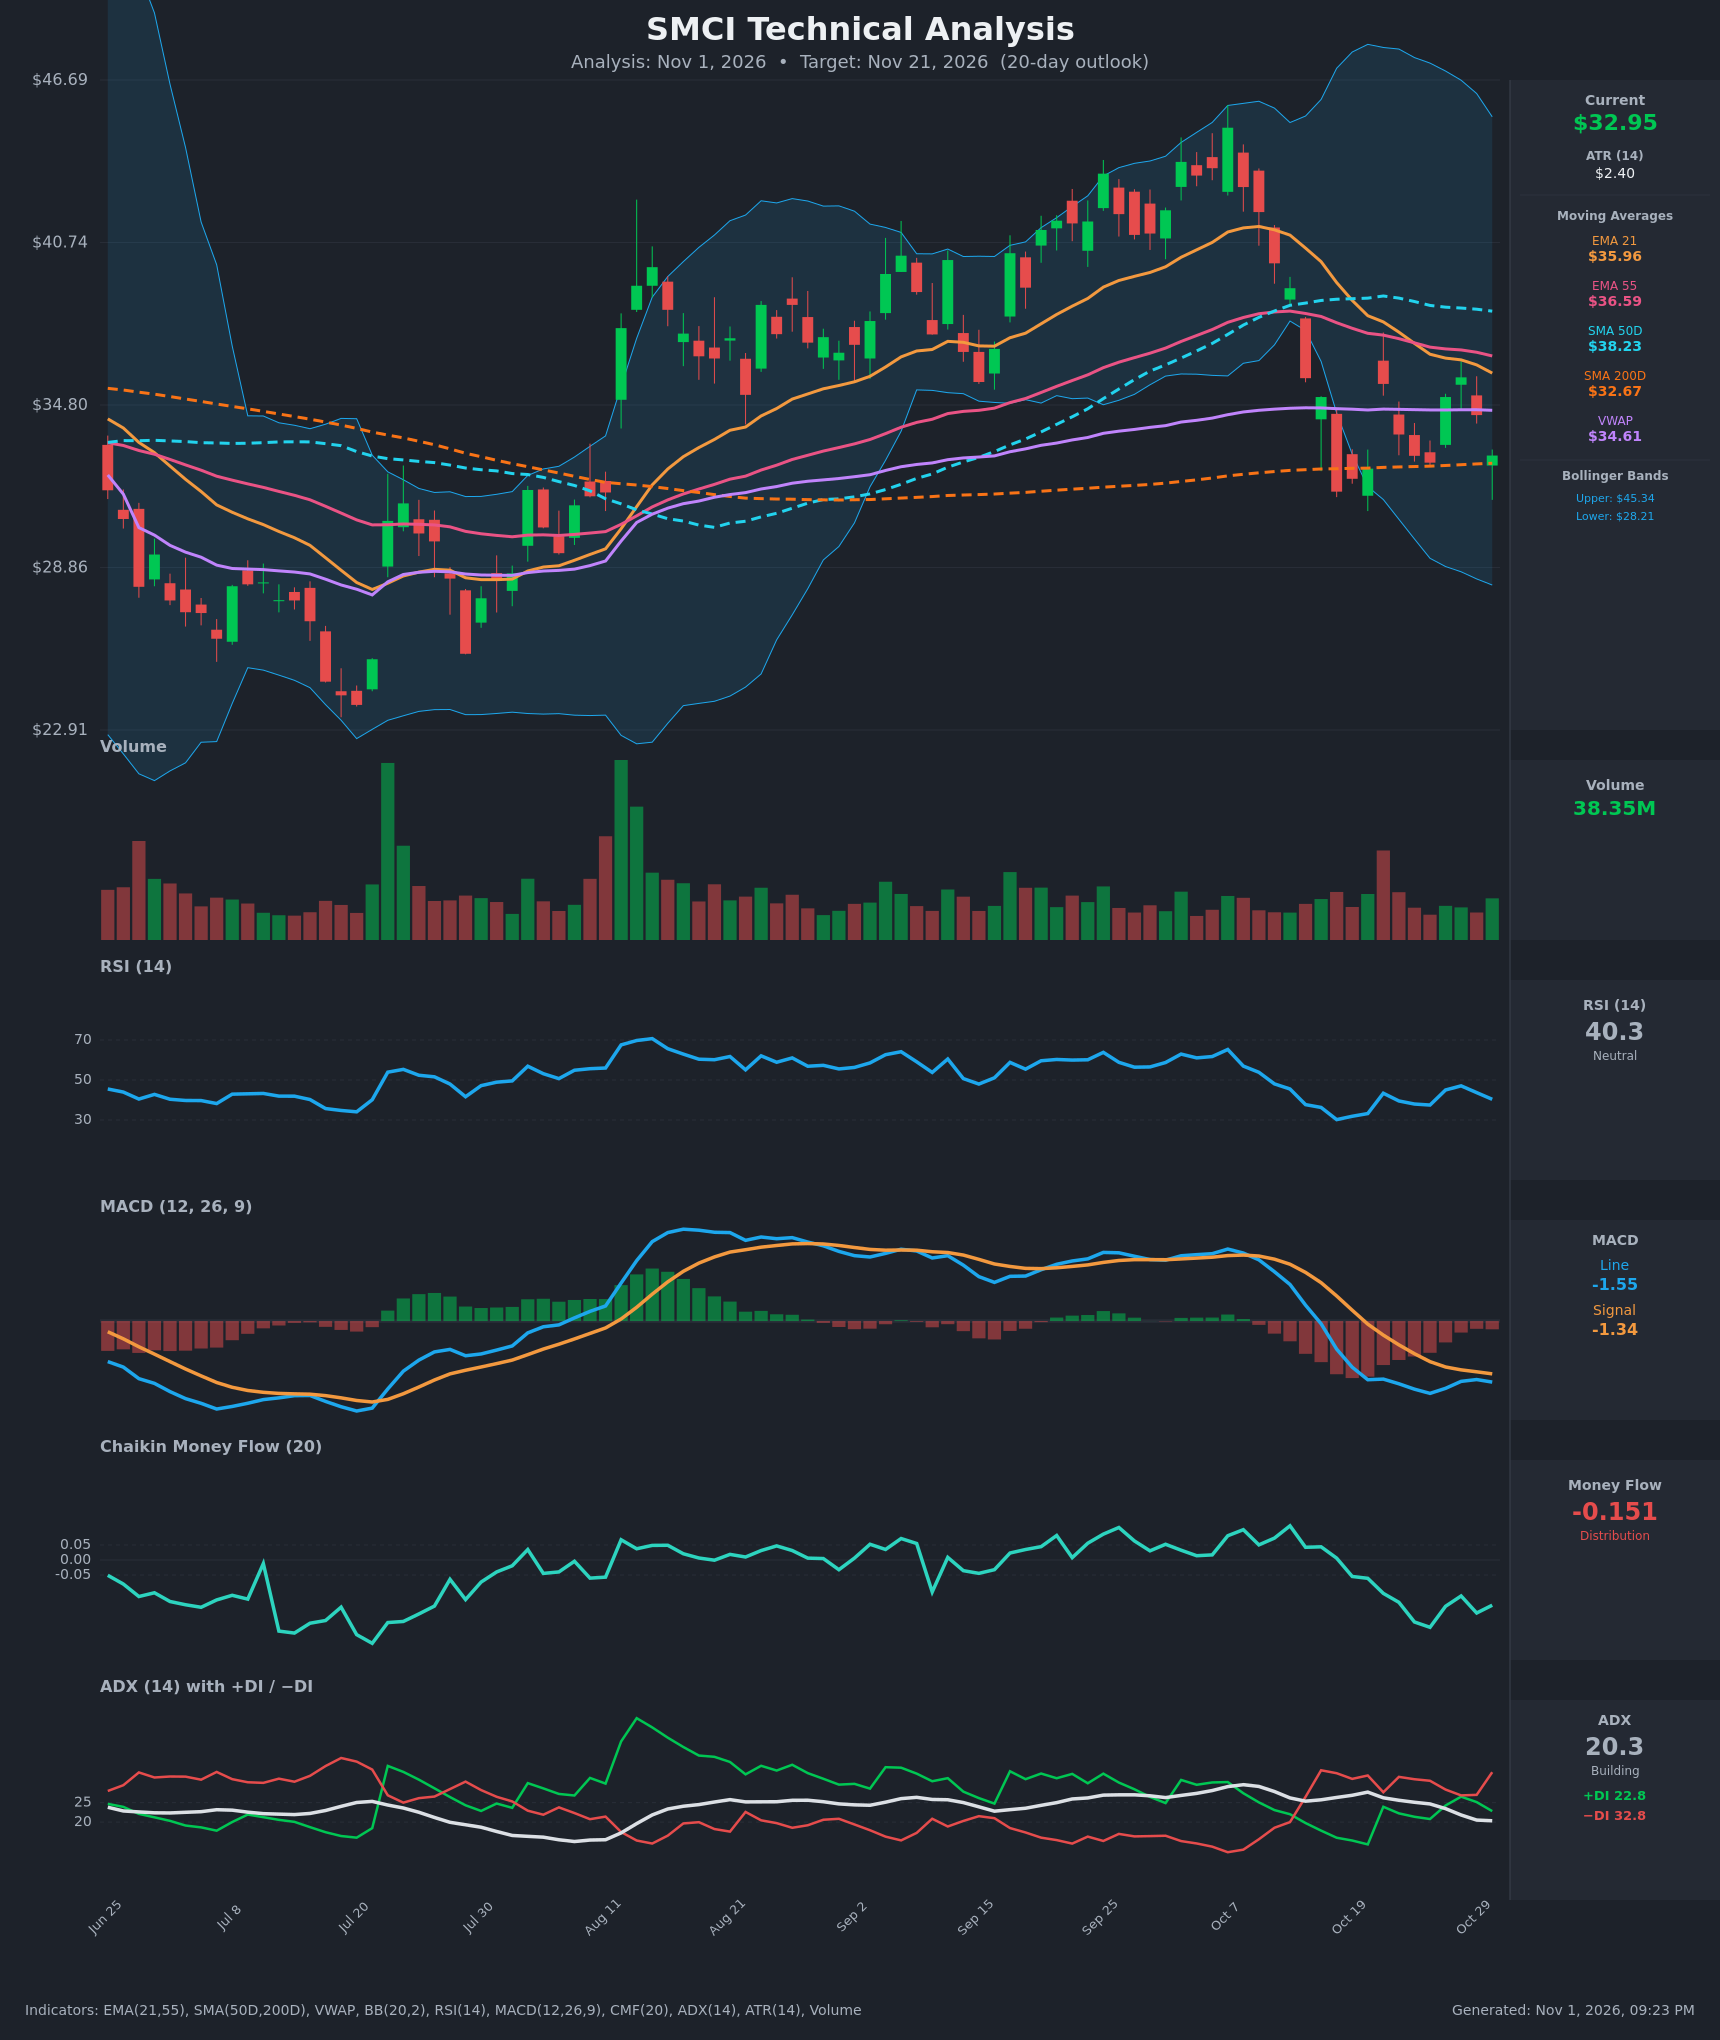
- RSI (14): 40.35, below the 50 midline and recovering from the 30.2 oversold low on Oct 16. The bounce to 47 failed and RSI is turning down again (47.1 → 40.3 over the last three bars). Momentum is soft with no oversold reading. [Bearish]
- 20 EMA: The 21 EMA is $35.96 and price at $32.95 is about 8% below it. The 21 EMA is also below the 55 EMA ($36.59) and both slope down, so the EMAs act as overhead resistance. The EMA21 crossed below the EMA55 around Oct 23, a bearish crossover. [Bearish]
- MACD: The line is -1.55 and the signal is -1.34, so the line is below the signal. It crossed bearishly on Oct 20 and is below zero. A brief narrowing of the histogram has turned back negative, so the downside momentum signal is renewed. [Bearish]
- Bollinger Bands (20): Upper is $45.34, lower is $28.21 and the midline is about $36.78. The bands are wide, reflecting high volatility after the October drop. Price is in the lower half, about 28% of the way from the lower to the upper band, with no squeeze. The midline is overhead resistance. [Bearish]
- CMF (20): -0.151 is well below -0.05. It has been negative since Oct 19 and is deteriorating, which shows sustained distribution. [Distribution]
- ADX (14): 20.3 and falling from about 27, so trend strength is fading toward range-bound. −DI (32.8) is above +DI (22.8), and the gap widened again on the latest bar. The bears keep control, but without a strong trend. [Weak Trend, Bearish Direction]
- Volume: 38.35M is average to moderate. The heaviest volume came on the Oct 16 selloff and the bounce volume was lighter, which suggests the rally lacked conviction. Price is sitting on the 200-day SMA ($32.67), which is critical support. [Neutral to Mildly Bearish]
DIVERGENCES & TRENDS
- There is no clear bullish RSI divergence. Price made a lower low on Oct 16 ($31.63) against RSI 30.2. The retest at $32.69 had RSI at 37.5, and price is again near $32.95 with RSI at 40.3. RSI has not made a new low, but the swing lows are not oversold enough to count as a meaningful divergence.
- MACD is making lower lows (-1.84 then -1.55 with a mix of readings). It has been flat to slightly down in the last few bars, so momentum is not recovering.
- The SMA50D ($38.23) remains above the SMA200D ($32.67), so there is no death cross. The 50D is rolling over and the gap is narrowing.
- Price is below the 21 EMA, 55 EMA, 50 SMA and VWAP ($34.61) and sits right on the 200 SMA.
- The Oct 21 and Oct 27-28 bounces were both sold at the 21 EMA and VWAP area, which shows overhead supply.
- The EMA21/55 bearish cross on about Oct 23 confirms the downtrend after the early-October peak near $45.
CHART PATTERNS
- Bearish Pennant / Flag (continuation): After the sharp drop from about $40 to $31.6, the choppy $32–$36 consolidation looks like a bearish flag or pennant. A break below $31.6 would project a measured move toward about $26–27 (a drop of about $8–9).
- Double bottom attempt (reversal): Price tested $31.6 and about $32.7 with a higher low, but a double bottom would only confirm above the neckline near $35.8. Price is not close to that level, so I treat this as lower probability.
- The 200-day SMA at about $32.67 is the pivot. The pattern bias favors a bearish continuation if the level breaks, with a bounce toward the $35–36 resistance if it holds.
POTENTIAL SCENARIOS
- Scenario 1: Bearish Breakdown Below the 200 SMA — Sellers keep control (−DI above +DI, CMF negative) and price closes below $31.60, completing the bearish flag. Trigger: daily close below $31.60 on rising volume. Target: $28.50 to $29.50, with extension to about $27. Invalidation: close above $36.00 (EMA21 and the flag top). (50% probability)
- Scenario 2: Neutral Range Chop Near the 200 SMA — The 200 SMA holds, ADX stays near 20 and price chops between $31.60 and $36. Trigger: repeated holds of $32.00 and rejections near $35–36. Target: $32 to $35. Invalidation: close outside the $31.60–$36.00 band. (28% probability)
- Scenario 3: Bullish Relief Rally — A bounce off the 200 SMA that reclaims the VWAP and EMAs, helped by the wide bands and oversold-ish RSI. Trigger: close above $35.80 with improving CMF. Target: $38.20 (SMA50D) with a stretch to $39–40. Invalidation: close back below $32.60. (22% probability)
PRICE TARGETS
For a 20-day horizon (ATR $2.40, giving a typical swing of about $2.40 × √20 ≈ $10.7), I weight the downside slightly more than the upside.
- Target Price: $30.80
- Expected Range: $26.50 to $36.50 (width $10.00, about 30% of current price). This is wider than the 14–21 day guideline of 8–12%. I chose it because of the high volatility (ATR about 7.3% of price and wide Bollinger Bands) after the recent 25% drop. The breakdown, chop and relief-rally scenarios span roughly this band.
- Key Levels: Support at $31.60 (the Oct 16 low, with the 200 SMA at $32.67 just above it), Resistance at $35.96 (EMA21, with the VWAP at $34.61 as the first hurdle)
OVERALL BIAS
OVERALL BIAS: BEARISH - Price is below all key short- and medium-term averages, −DI leads +DI, MACD is below its signal line, the EMA21 has crossed below the EMA55 and CMF shows distribution. The bearish flag setup favors a break of the $31.60 low and a drift toward $30 or lower, while the 200 SMA offers only a tenuous floor.
This is educational analysis and not financial advice.