QCOM 20-day bearish forecast — Nov 1, 2026
- Bias: Bearish
- Timeframe: 20 days (made Nov 1, 2026, target date Nov 20, 2026)
- Price at analysis: $164.79
- Price target: $161.50
- Expected range: $153.00 – $171.50
- Result: Pending — graded after the close on Nov 20, 2026
Get a free AI analysis of QCOM today
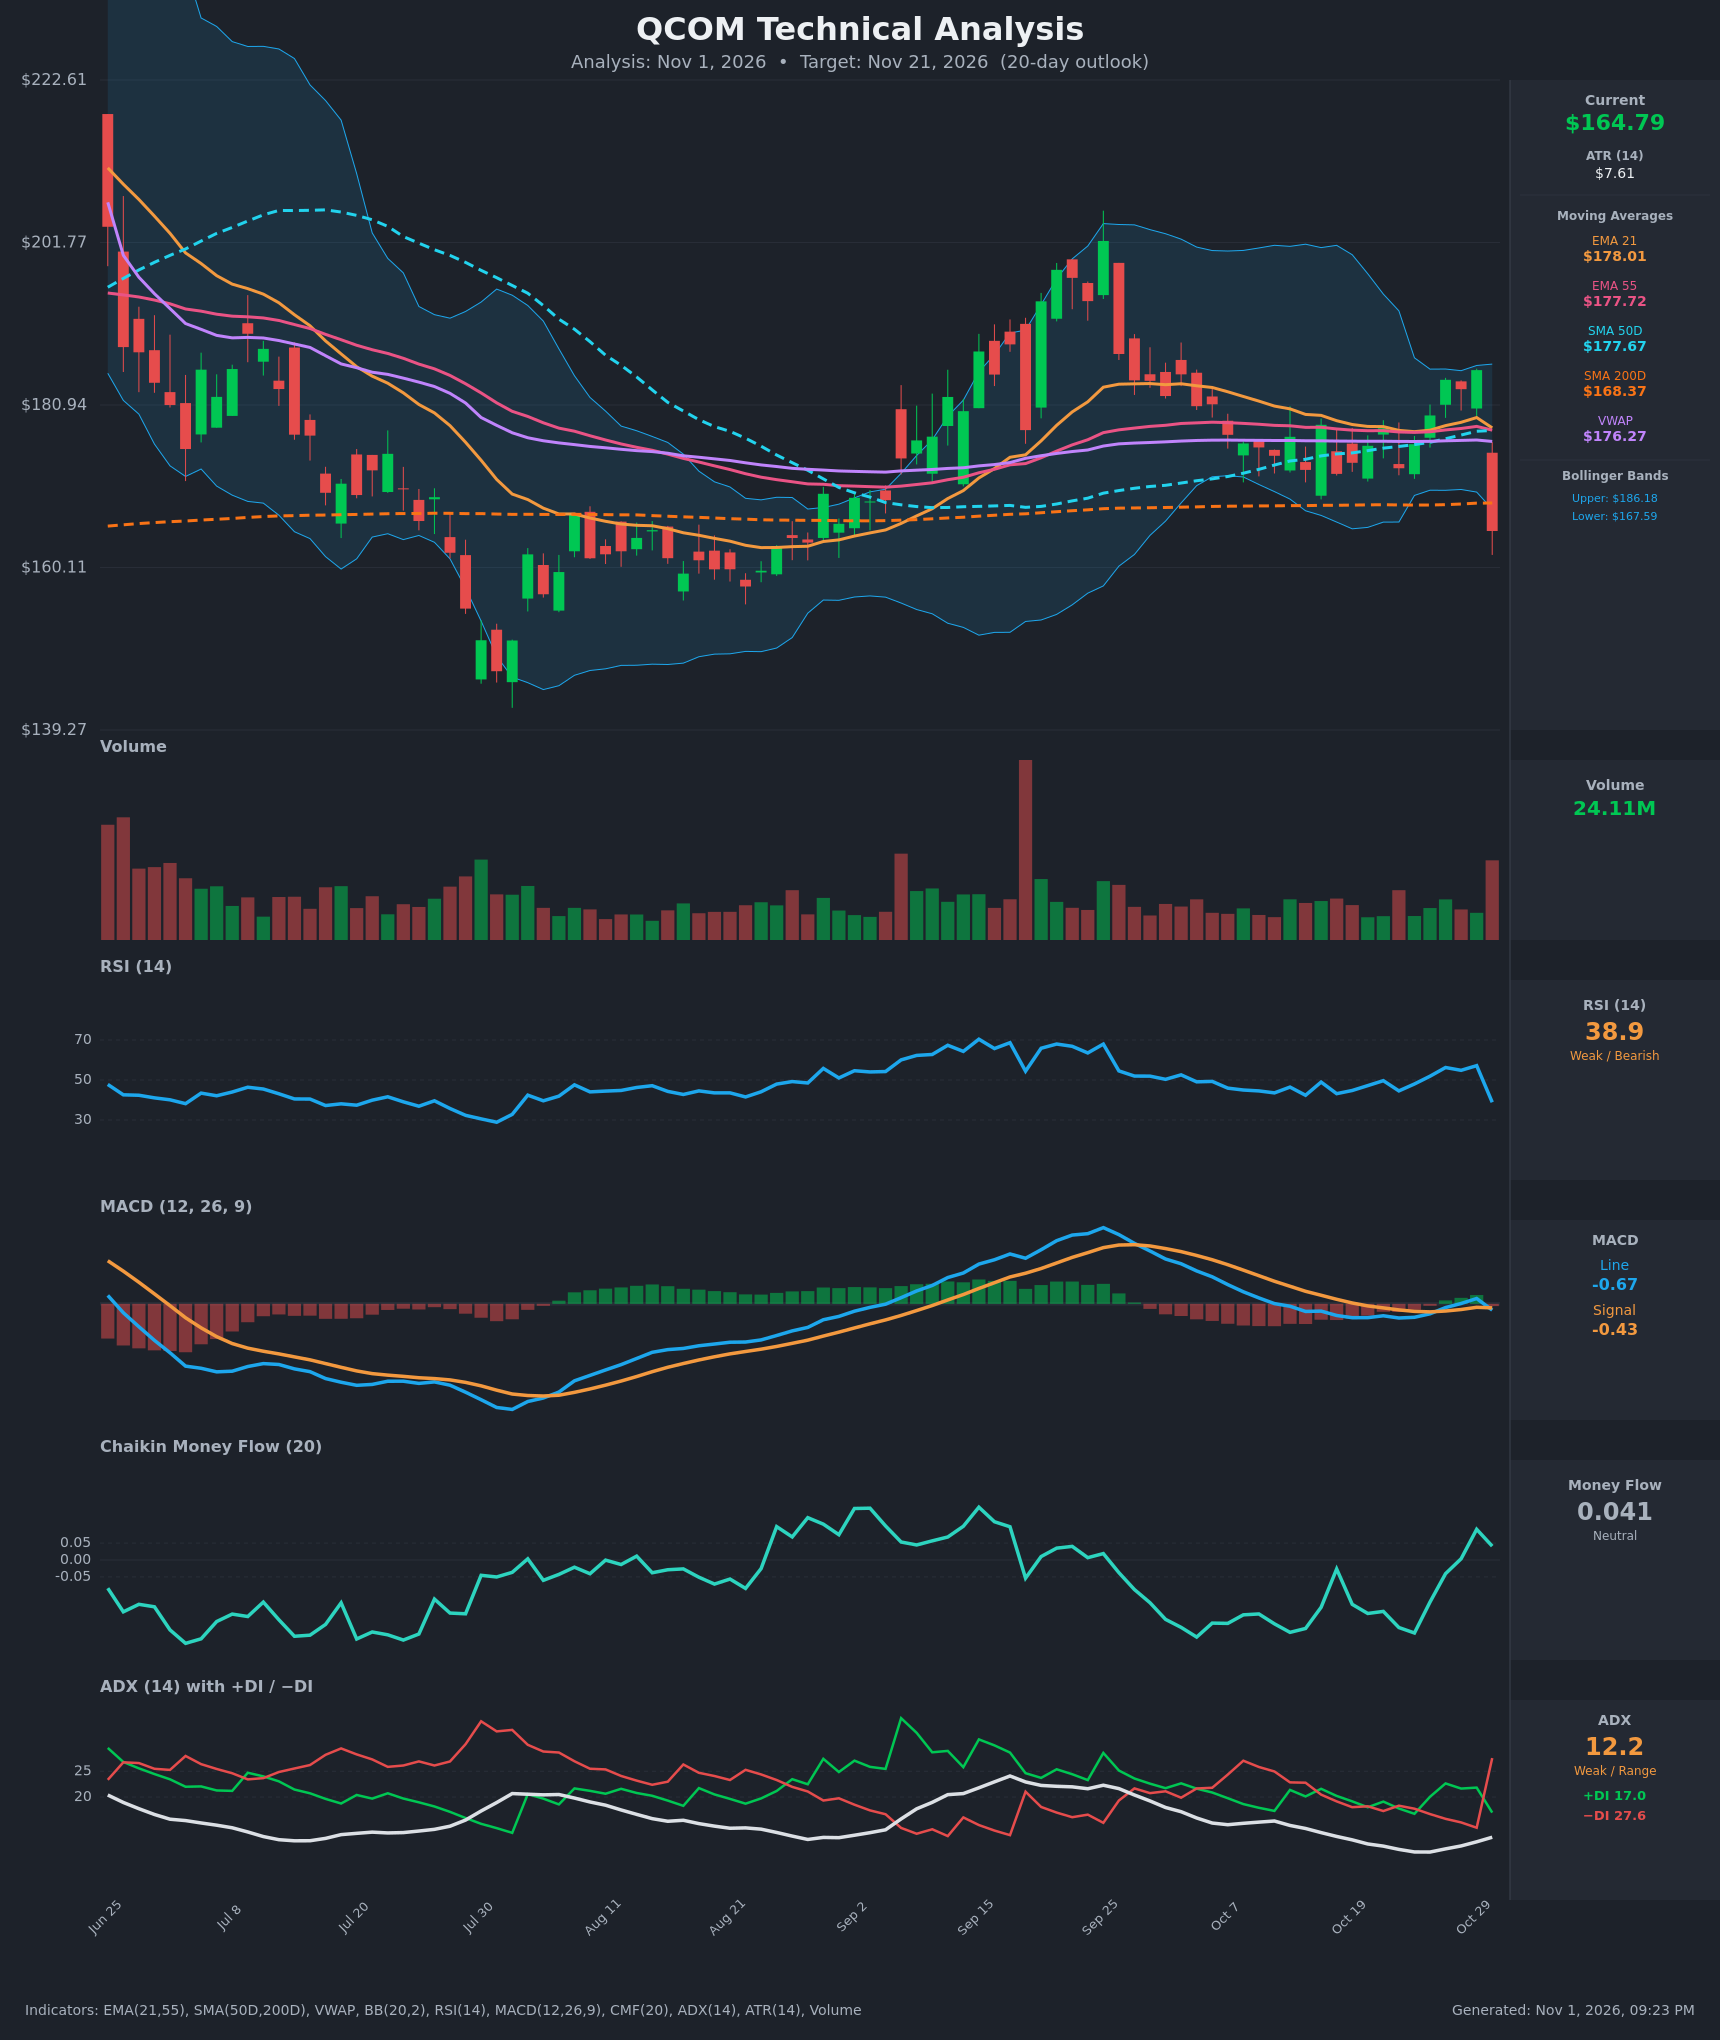
Analysis
TECHNICAL INDICATORS
- RSI (14): 38.86, down sharply from 57.2 the prior day. This is a weak reading but not yet oversold (<30). Momentum has turned down, and the nearest prior low was around 29 in late July. [Bearish]
- 20 EMA: The EMA 21 is $178.01 and price at $164.79 is about 7.4% below it. EMA 21 (178.01) sits just above EMA 55 (177.72), so the two are flat and converged, and the EMA 21 is now overhead resistance. [Bearish]
- MACD: Line -0.665 is below Signal -0.428, a fresh bearish crossover. It crossed up on Oct 28-29 and reversed immediately, so the histogram is turning negative. Both lines sit near zero, which limits how strong the signal is. [Bearish]
- Bollinger Bands (20): Upper $186.18, lower $167.59. Price closed about $2.80 below the lower band after a roughly 11% one-day drop. This is a volatility-expansion breakdown. It can also trigger a snapback toward the lower band, but it more often leads to a band-walk when it follows a gap on news. [Bearish]
- CMF (20): 0.041, between -0.05 and +0.05, so neutral. It was rising into the drop (+0.091 on Oct 29) and will likely roll over quickly given the heavy-volume down day. It is a lagging reading here. [Neutral]
- ADX (14): 12.2, a weak trend and range-like backdrop before the drop. −DI jumped to 27.6 from 14.0 while +DI fell to 17.0, a bearish DI crossover. The ADX is only beginning to rise, so trend strength is not yet confirmed. [Weak Trend, bearish direction]
- Volume: 24.11M, well above the recent 10-20 day average, on a large red candle. This points to institutional, news-driven distribution rather than a drift lower. [Bearish - high-volume breakdown]
Other levels:
- VWAP: $176.27 is about 7% above price and acts as resistance. [Bearish]
- SMA 200D: $168.37. Price lost this long-term support on the close, and it now becomes resistance. [Bearish]
- SMA 50D: $177.67, also well above price. [Bearish]
DIVERGENCES & TRENDS
- There is no classic divergence. RSI and MACD fell in step with price, which confirms the move. RSI had made a lower high at about 57 versus about 70 in September, and MACD histogram momentum faded through October. Both warned of weakening upside before the gap.
- Mid-to-late October was a tight, low-ADX (9-15) consolidation with the EMAs, SMA 50D and VWAP all converged near $176-178. The Oct 30 candle resolved that compression to the downside.
- Crossovers:
- MACD bearish cross on Oct 30.
- −DI crossed above +DI.
- Price broke below the lower Bollinger Band and SMA 200D (168.37).
- There is no golden or death cross. SMA 50D ($177.67) remains above SMA 200D ($168.37), so the long-term structure is only now being challenged.
- CMF is the one indicator that has not turned. It is still slightly positive, but it is likely to fall in the next few bars.
CHART PATTERNS
- Symmetrical Triangle / consolidation breakdown: Price compressed between roughly $172 and $185 in October with very low ADX, then broke down on a gap with heavy volume. The bearish resolution is the pattern most consistent with the diagram. A measured-move target would sit near the low $150s, around the Aug-Sep range lows.
- Possible Bearish Double Top (broad): The September high near $200 and the October rally to about $185 form lower highs. This is only a loose analogue, and the neckline near $160-168 is being tested now.
- Counterpoint: The Aug-Sep base ($155-$170) lies just below. It may act as a support zone and produce a relief bounce toward the $168 SMA 200D.
POTENTIAL SCENARIOS
- Scenario 1: Bearish Post-Gap Continuation — Price fails to reclaim the SMA 200D, and the high-volume gap down is followed by a drift lower as MACD and −DI strengthen and ADX rises above 20. Trigger: daily close below the Oct 30 low (~$163) with continued −DI > +DI. Target: $155-$158, with an extension to ~$150. Invalidation: daily close above $168.40 (SMA 200D) and then $172. (50% probability)
- Scenario 2: Neutral Base and Chop — Price stabilizes in the Aug-Sep demand zone, with the gap acting as a ceiling and the $157-$168 band containing trade. Trigger: lower-volume candles that hold $158-$160 and RSI stabilizing near 35-45. Target: $160-$168 range. Invalidation: close below $157 or above $170. (20% probability)
- Scenario 3: Bullish Oversold Rebound — The price below the lower Bollinger Band and the SMA 200D loss trigger a mean-reversion bounce, with price reclaiming the SMA 200D. Trigger: close above $168.40 with a rising RSI. Target: $172-$176, a partial gap fill toward the EMA 21 / VWAP area. Invalidation: rejection at $168-$170 and a close below $160. (30% probability)
PRICE TARGETS
Range width: $171.50 - $153.00 = $18.50, or about 11.2% of the current price, which fits the 14-21 day guidance of 8-12%.
- Target Price: $161.50 (20-day, about 2% below current)
- Expected Range: $153.00 to $171.50
- Key Levels: Support at $156.00, Resistance at $168.40
OVERALL BIAS
OVERALL BIAS: BEARISH - A high-volume gap-down break below the lower Bollinger Band and the SMA 200D, together with a fresh MACD bearish cross and −DI taking control (27.6 vs 17.0), favors continuation lower. A relief bounce into $168 is possible, but that level is now resistance and is more likely to cap rallies. The low ADX and nearby Aug-Sep support limit the downside to a modest drift rather than a collapse.
This is educational analysis and not financial advice.