TLT 20-day bullish forecast — Nov 1, 2026
- Bias: Bullish
- Timeframe: 20 days (made Nov 1, 2026, target date Nov 20, 2026)
- Price at analysis: $81.84
- Price target: $82.90
- Expected range: $78.60 – $86.60
- Result: Pending — graded after the close on Nov 20, 2026
Get a free AI analysis of TLT today
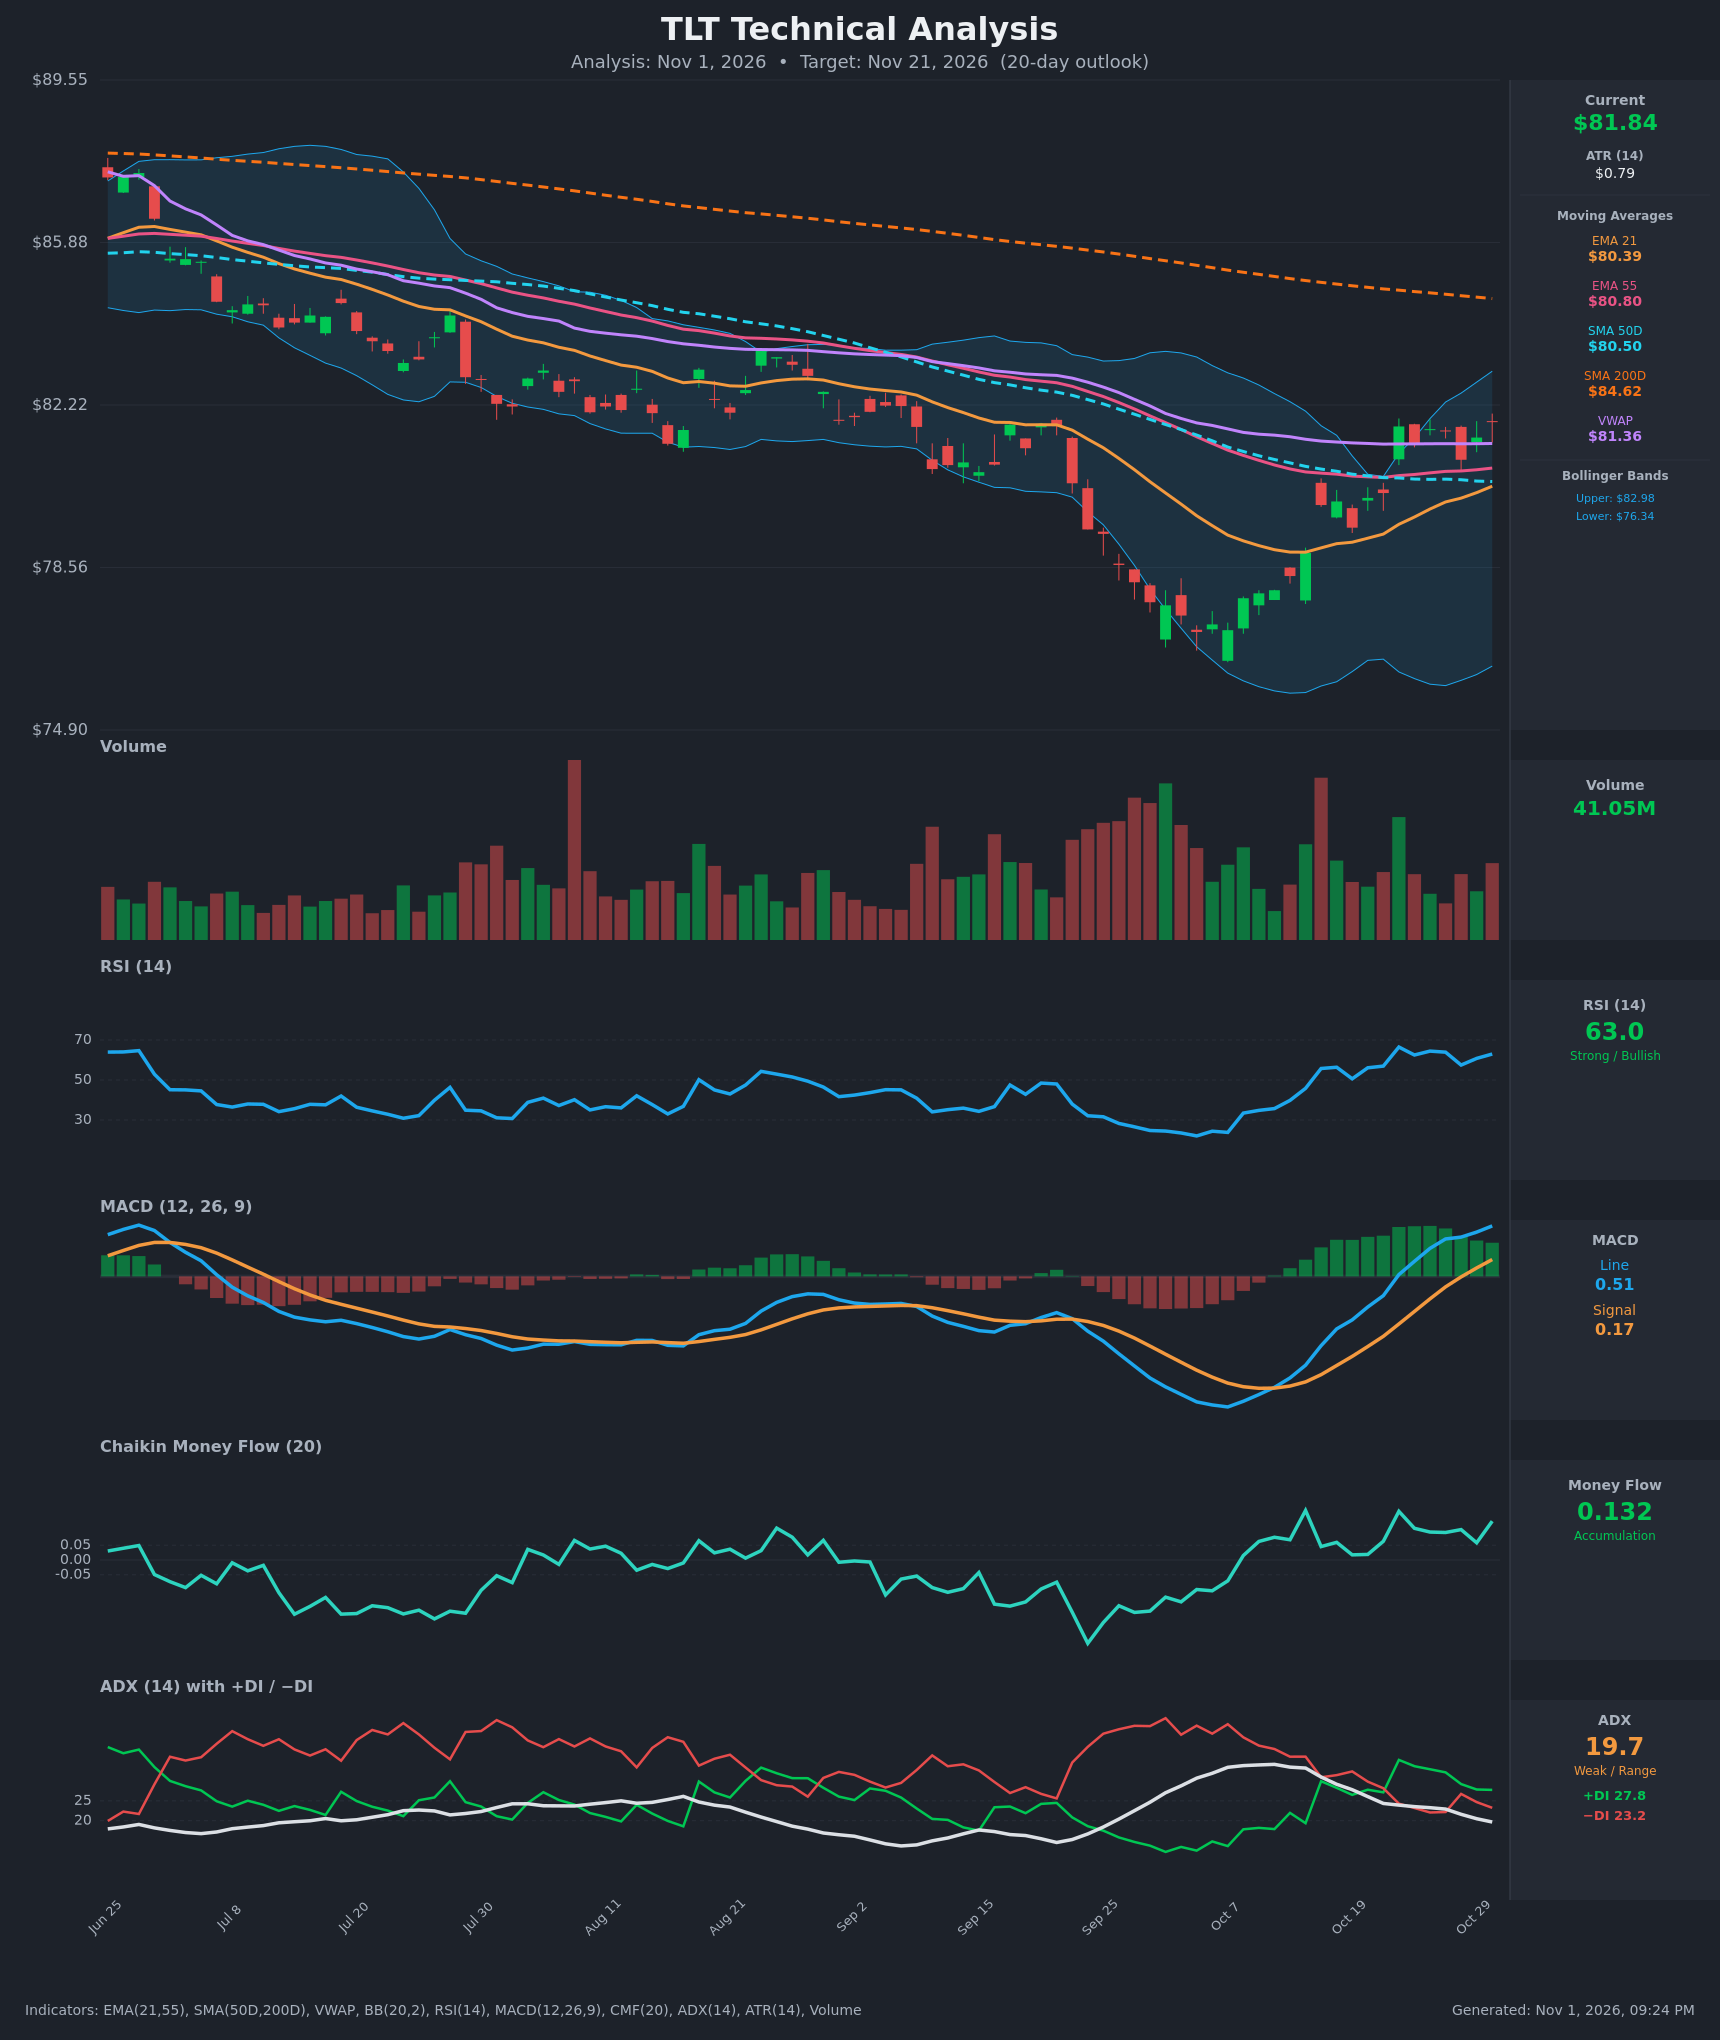
Analysis
TECHNICAL INDICATORS
- RSI (14): 62.98, up from the ~35 oversold-ish low on Oct 12. It has held in the 57-66 range for the last 8 sessions. Momentum is positive but not overbought. [Bullish]
- 20 EMA (EMA 21): $80.39, with price at $81.84 about 1.8% above it. The EMA is rising steadily and has crossed above its Oct 12 level of $78.96. It acts as support on pullbacks. [Bullish]
- MACD: Line 0.506 vs signal 0.169. The bullish crossover happened around Oct 22, and the histogram (+0.34) has widened every day since. Momentum is clearly positive, though the histogram is flattening near its peak. [Bullish]
- Bollinger Bands (20): Upper $82.98, lower $76.34, midline about $79.66. Price sits in the upper half, about $1.14 below the upper band. The bands are wide from the September-October selloff and are starting to contract. The lower band sits far below price. [Bullish]
- CMF (20): 0.132, positive for the entire recent window, with the latest reading the highest of the last six sessions. This shows accumulation and buying pressure. [Accumulation]
- ADX (14): 19.7 and falling from 34 on Oct 12, so the prior downtrend has lost strength. +DI (27.8) is above −DI (23.2), a modest bullish tilt, but ADX below 20 means there is no strong trend yet. [Weak Trend + Bullish tilt]
- Volume: 41.05M on the latest bar, in line with the recent average. The rally days (Oct 22) carried higher volume than the pullback days, and there has been no capitulation-style spike on the pullbacks. [Mildly supportive]
DIVERGENCES & TRENDS
- Price has made a V-shaped recovery from about $76.5 in early October. RSI, MACD and CMF have all turned up with price, so there is no bearish divergence. MACD has risen steadily, though its histogram is plateauing.
- The EMA 21 crossed above the SMA 50D around Oct 26-27 and sits just below EMA 55 ($80.39 vs $80.80). A bullish EMA21/EMA55 cross is imminent.
- SMA 50D ($80.50) is well below SMA 200D ($84.62), which is a death cross regime. The long-term trend is still down, and SMA 200D is declining, so it caps rallies.
- Price is above VWAP ($81.36) by a small margin. The consolidation around $81-82 over the last 7 bars is the market digesting the move.
- ADX has dropped below 20 as the DI lines converged and then flipped, with +DI now on top. This is the early stage of a possible trend change, not yet a confirmed one.
CHART PATTERNS
- Bullish Double Bottom / V-bottom recovery: Lows around $76.5-$77 in early October, followed by a sharp recovery. The pattern is more V-shaped than a textbook double bottom, but it acts as a reversal base.
- Mini consolidation / flag-like pause near $81-82 after the Oct 22 gap-up, resembling a Bullish Flag/Pennant. Its measured move points toward $83-85.
- Overhead, the declining SMA 200D (~$84.6) and the band at $82.98 are the main barriers. The measured move from the base ($76.5 to the $81.7 neckline) projects to about $86.9, which is likely too far for 20 days.
POTENTIAL SCENARIOS
- Scenario 1: Bullish Breakout Toward the 200-day — The consolidation resolves upward, helped by MACD, CMF and the EMA 21/55 cross. Trigger: daily close above $82.50-$83.00 (upper Bollinger band). Target: $84.00-$84.60 (SMA 200D zone). Invalidation: close below $80.40 (EMA 21). (50% probability)
- Scenario 2: Neutral Range Chop — Price oscillates between the $80.4 support cluster and the $83 band/resistance as ADX stays below 20. Trigger: failure to close above $83 and holding above $80.5. Target: $80.50-$83.00. Invalidation: close outside the range. (28% probability)
- Scenario 3: Bearish Failed Rally — The recovery stalls against the downward-sloping SMA 200D and the long-term downtrend reasserts. Trigger: close below $80.40 with the MACD histogram turning negative. Target: $78.50-$79.00. Invalidation: reclaim of $82.50. (22% probability)
PRICE TARGETS
- Target Price: $82.90 (20 days)
- Expected Range: $78.60 to $86.60 (width $8.00, about 9.8% of current price, consistent with the 14-21 day guidance of 8-12%)
- Key Levels: Support at $80.40 (EMA 21, with the SMA 50D at $80.50 and EMA 55 at $80.80 just above), Resistance at $82.98 (upper Bollinger Band, followed by the SMA 200D near $84.60)
OVERALL BIAS
OVERALL BIAS: BULLISH - Price is above its EMA 21 and VWAP, MACD has crossed bullishly with a rising histogram, CMF shows steady accumulation, and +DI leads −DI after the V-shaped recovery. The declining SMA 200D near $84.6 should cap the upside, so the target is modest.
This is educational analysis and not financial advice.