TSLA 20-day bullish forecast — Nov 1, 2026
- Bias: Bullish
- Timeframe: 20 days (made Nov 1, 2026, target date Nov 20, 2026)
- Price at analysis: $399.81
- Price target: $411.00
- Expected range: $380.00 – $421.00
- Result: Pending — graded after the close on Nov 20, 2026
Get a free AI analysis of TSLA today
Analysis
TECHNICAL INDICATORS
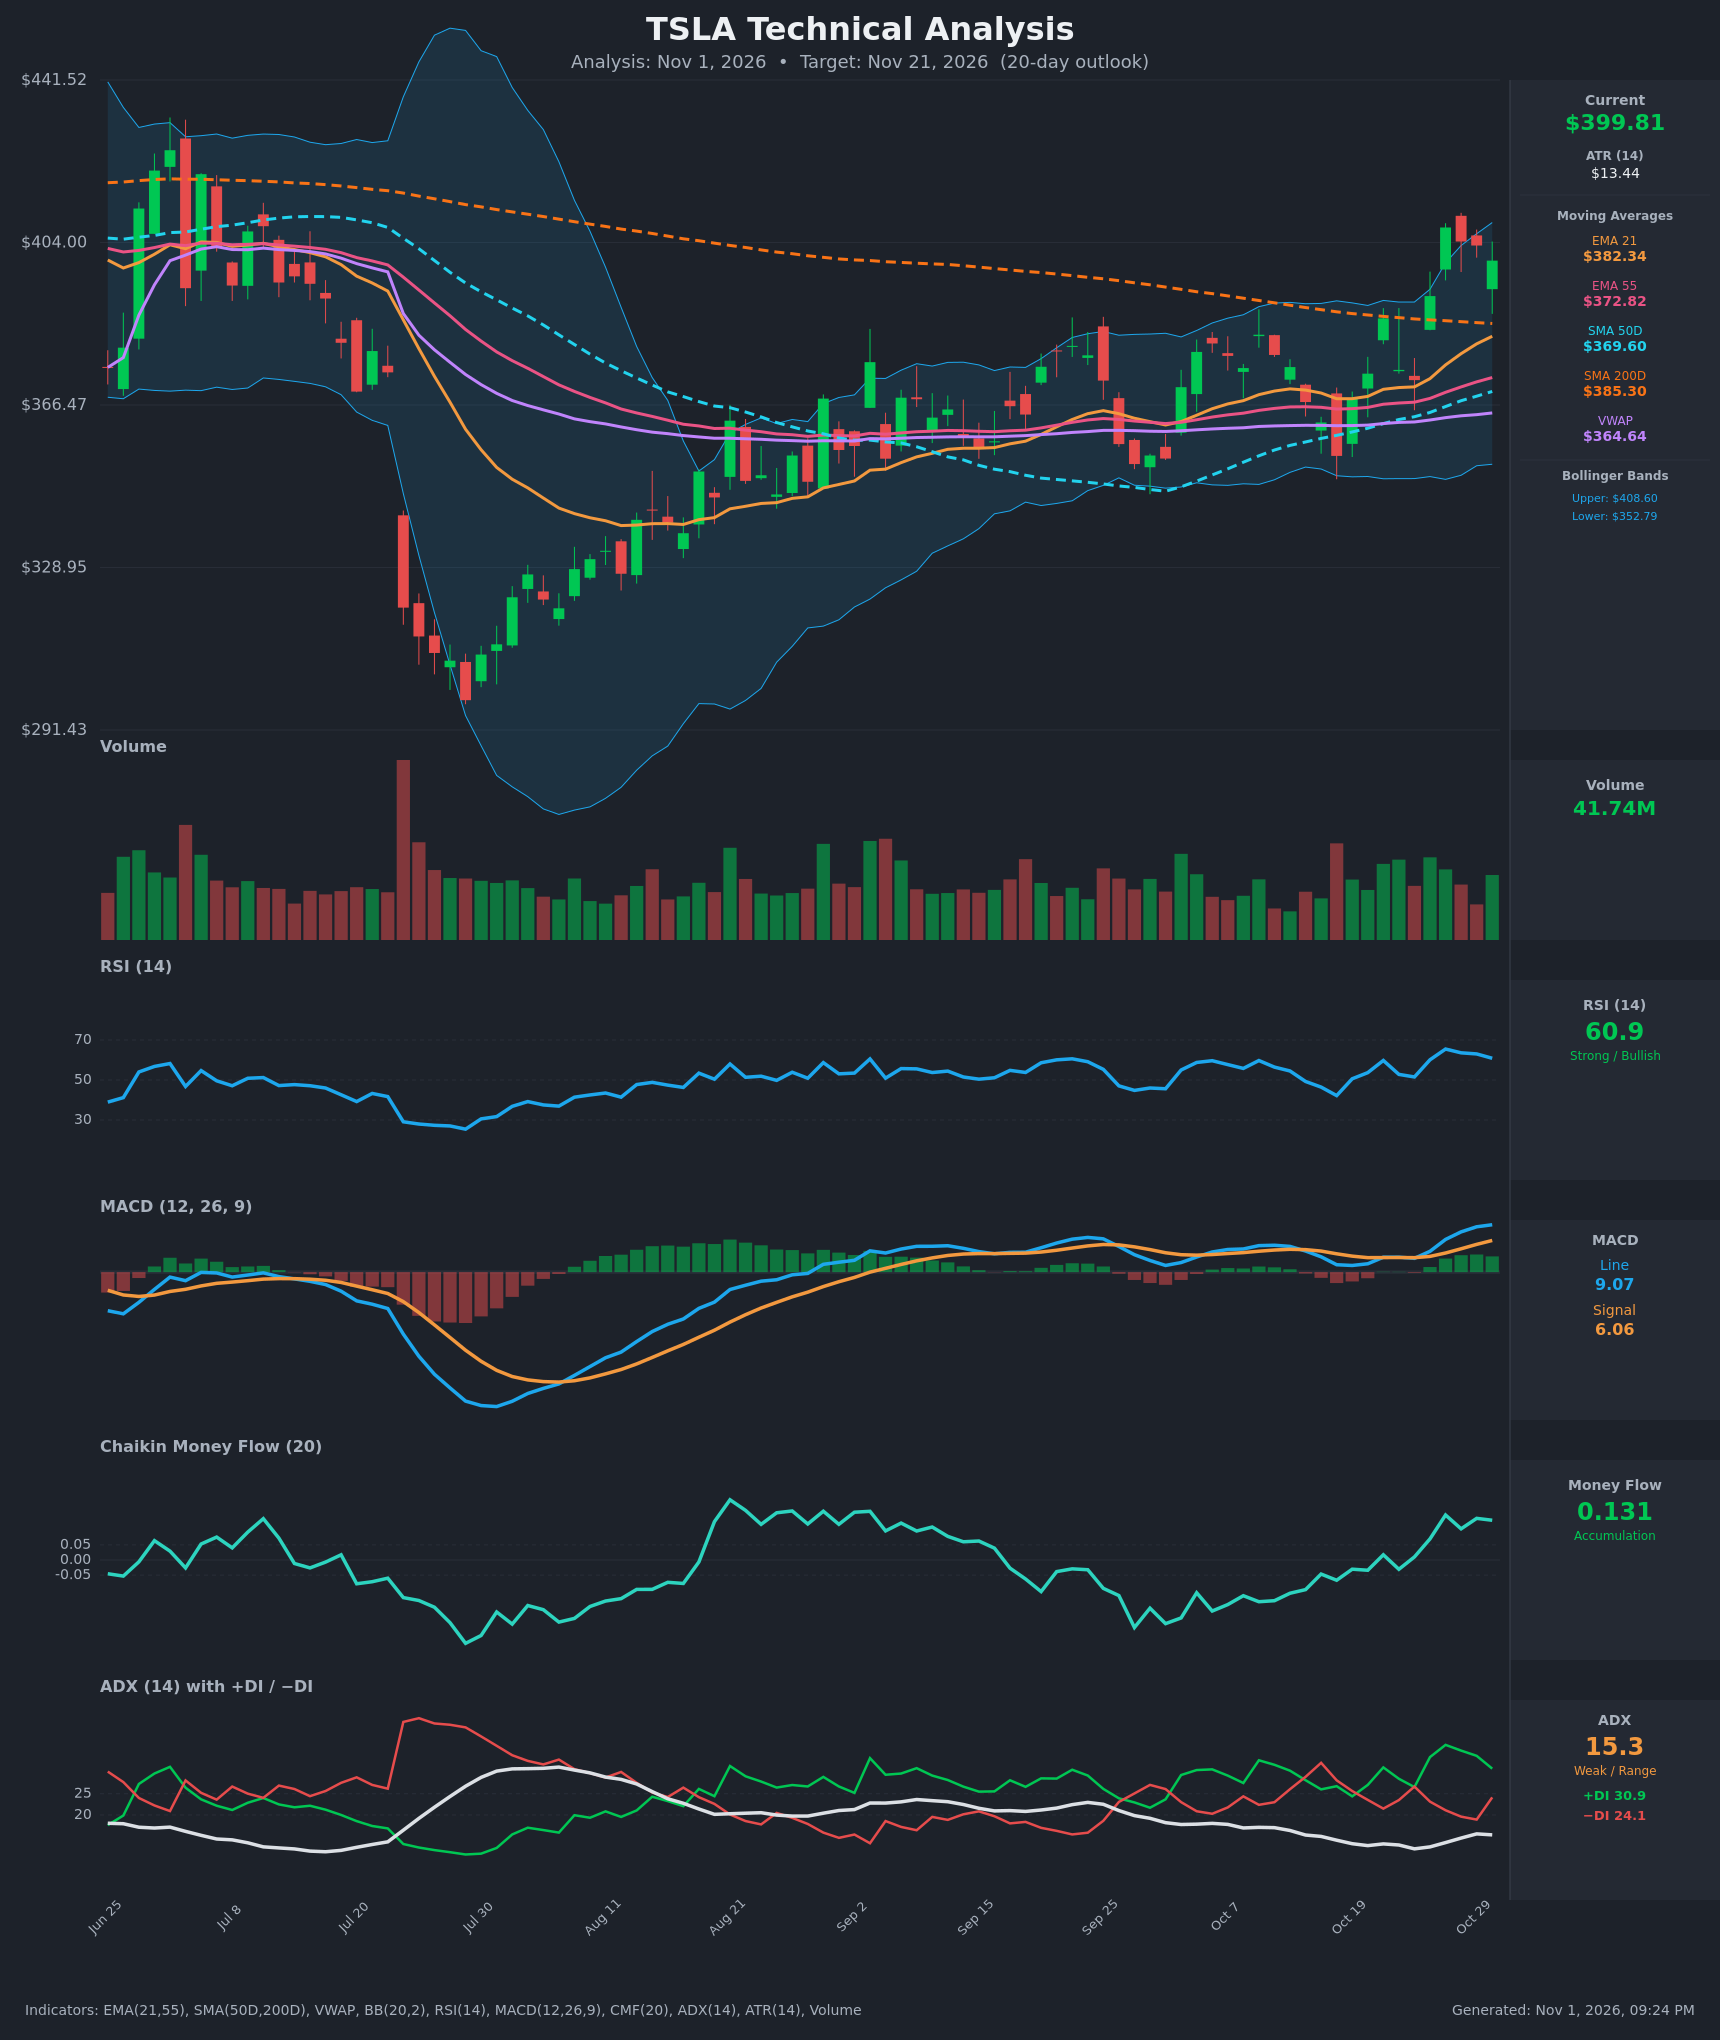
- RSI (14): 60.86, down from a peak of 65.5 on Oct 27 but still above 50. Momentum is positive with room before 70 overbought, though it has cooled for three sessions. [Bullish]
- 20 EMA: The supplied value is the EMA 21 at $382.34. Price at $399.81 is about 4.6% above it, and the EMA is rising and sits above the EMA 55 ($372.82). The EMA 21 is the first dynamic support on a pullback. [Bullish]
- MACD: Line 9.07 is above signal 6.06, so the histogram is positive (about +3.0) and widening. The line crossed above the signal around Oct 21–26, and both lines are rising and above zero. [Bullish]
- Bollinger Bands (20): Upper $408.60, lower $352.79, so price sits in the upper quarter of the bands (about 84% of the way up). The bands are moderately wide after a long squeeze. Price is riding the upper half but has not yet closed decisively outside the band, which leaves some risk of mean reversion toward the midline (~$380.70). [Neutral]
- CMF (20): 0.131, well above +0.05, and it has moved from negative (-0.135 on Oct 12) to sustained positive readings since Oct 26. This shows real accumulation on the breakout. [Accumulation]
- ADX (14): 15.3 is below 20, so there is no established trend. +DI (30.9) is above −DI (24.1), so bulls have directional control. However, −DI ticked up and +DI slipped on the last bar, so the trend is not yet confirmed. [Weak Trend, Bullish lean]
- Volume: 41.74M, roughly average to slightly below average compared with the spikes in the chart. The breakout candles on Oct 26–27 came on firmer volume, while the pullback bar is lighter. Confirmation is only modest. [Mildly Bullish]
Other moving-average context:
- Price is above the SMA200 ($385.30), SMA50 ($369.60) and VWAP ($364.64).
- The SMA50 is below the SMA200, so there is no golden cross yet, although the gap has narrowed from about $34 to about $15.7 and the SMA50 is rising.
- The EMA21 crossed above the EMA55 weeks ago, which is a positive trend alignment.
DIVERGENCES & TRENDS
- There is no major divergence. The RSI high on Oct 27 (65.5) matched the price high, and MACD kept making higher highs (9.07), so momentum confirms price.
- A minor caution is that price made a slightly lower close from $407.46 to $399.81 while ADX stayed below 20. This points to a breakout without a strong trend, which is more prone to retests.
- The MACD line crossed above the signal in late October and the histogram is expanding.
- Price reclaimed the SMA200 (~$385) on Oct 26–27 after months below it, a major trend-regime signal.
- CMF has trended up from -0.135 to +0.131 over the last 15 bars, while RSI rebounded from 42 to 61. Both show improving internals.
- +DI crossed back above −DI on Oct 21 and again on Oct 26, and has held since.
CHART PATTERNS
- Range breakout / rounded base: From the August low (~$300) price recovered in a V-to-rounded shape, then consolidated in a roughly $350–$386 range from late Aug to mid-Oct. It then broke above the range and the SMA200. This resembles an Ascending Triangle / Bullish Flag-style continuation from the reference diagram. The measured move of the ~$35–40 range height added to the ~$385 breakout point implies about $420–$425.
- Retest behavior: The current pullback from $407 to $400 looks like a shallow flag or retest. A hold above $385–$390 keeps the breakout valid.
- Caveat: There is overhead supply near the Jun–Jul highs ($404–$430) and the Oct 27–28 high (~$414). A Bearish Double Top is possible if price fails near $407–$414 twice, but it is not confirmed. The neckline would be around $372–$375.
POTENTIAL SCENARIOS
- Scenario 1: Bullish Breakout Continuation — Price holds the SMA200/EMA21 zone, MACD stays above signal and CMF stays positive, and price pushes through the upper Bollinger Band and the Oct 27 high. Trigger: close above $408.60, then above $414. Target: $411–$425, with the measured move near $420–$425. Invalidation: daily close below $382 (EMA21 and SMA200 zone). (55% probability)
- Scenario 2: Bearish Failed Breakout / Mean Reversion — The weak ADX (<20) lets the breakout fail as a double top near $407–$414. Price falls back through the SMA200 into the middle of the old range. Trigger: close below $385 with CMF dropping below 0.05 and a MACD bearish cross. Target: $370 (EMA55/SMA50), then $352 (lower band). Invalidation: close back above $408. (30% probability)
- Scenario 3: Neutral Consolidation — Price chops between $385 and $410 as ADX stays low. Trigger: failure to close outside the band either way. Target: $390–$405. Invalidation: close outside $380–$415. (15% probability)
PRICE TARGETS
- Target Price: $411.00 (20-day horizon, about +2.8% from $399.81)
- Expected Range: $380.00 to $421.00 ($41 width ≈ 10.3% of the current price, consistent with the 14–21 day guideline)
- Key Levels: Support at $385.30 (SMA200, with EMA21 at $382.34 just beneath), Resistance at $415.00 (recent swing high, with the upper Bollinger Band at $408.60 as the first hurdle)
OVERALL BIAS
OVERALL BIAS: BULLISH - Price has broken above the SMA200 and every other moving average, MACD is above signal with a widening histogram, CMF shows clear accumulation, and +DI leads −DI. The low ADX (15.3) and proximity to the upper Bollinger Band keep conviction moderate, so a retest of $385 is possible before a push toward ~$411.
This is educational analysis and not financial advice.