WMT 20-day bullish forecast — Nov 1, 2026
- Bias: Bullish
- Timeframe: 20 days (made Nov 1, 2026, target date Nov 20, 2026)
- Price at analysis: $123.51
- Price target: $126.50
- Expected range: $118.00 – $131.00
- Result: Pending — graded after the close on Nov 20, 2026
Get a free AI analysis of WMT today
Analysis
TECHNICAL INDICATORS
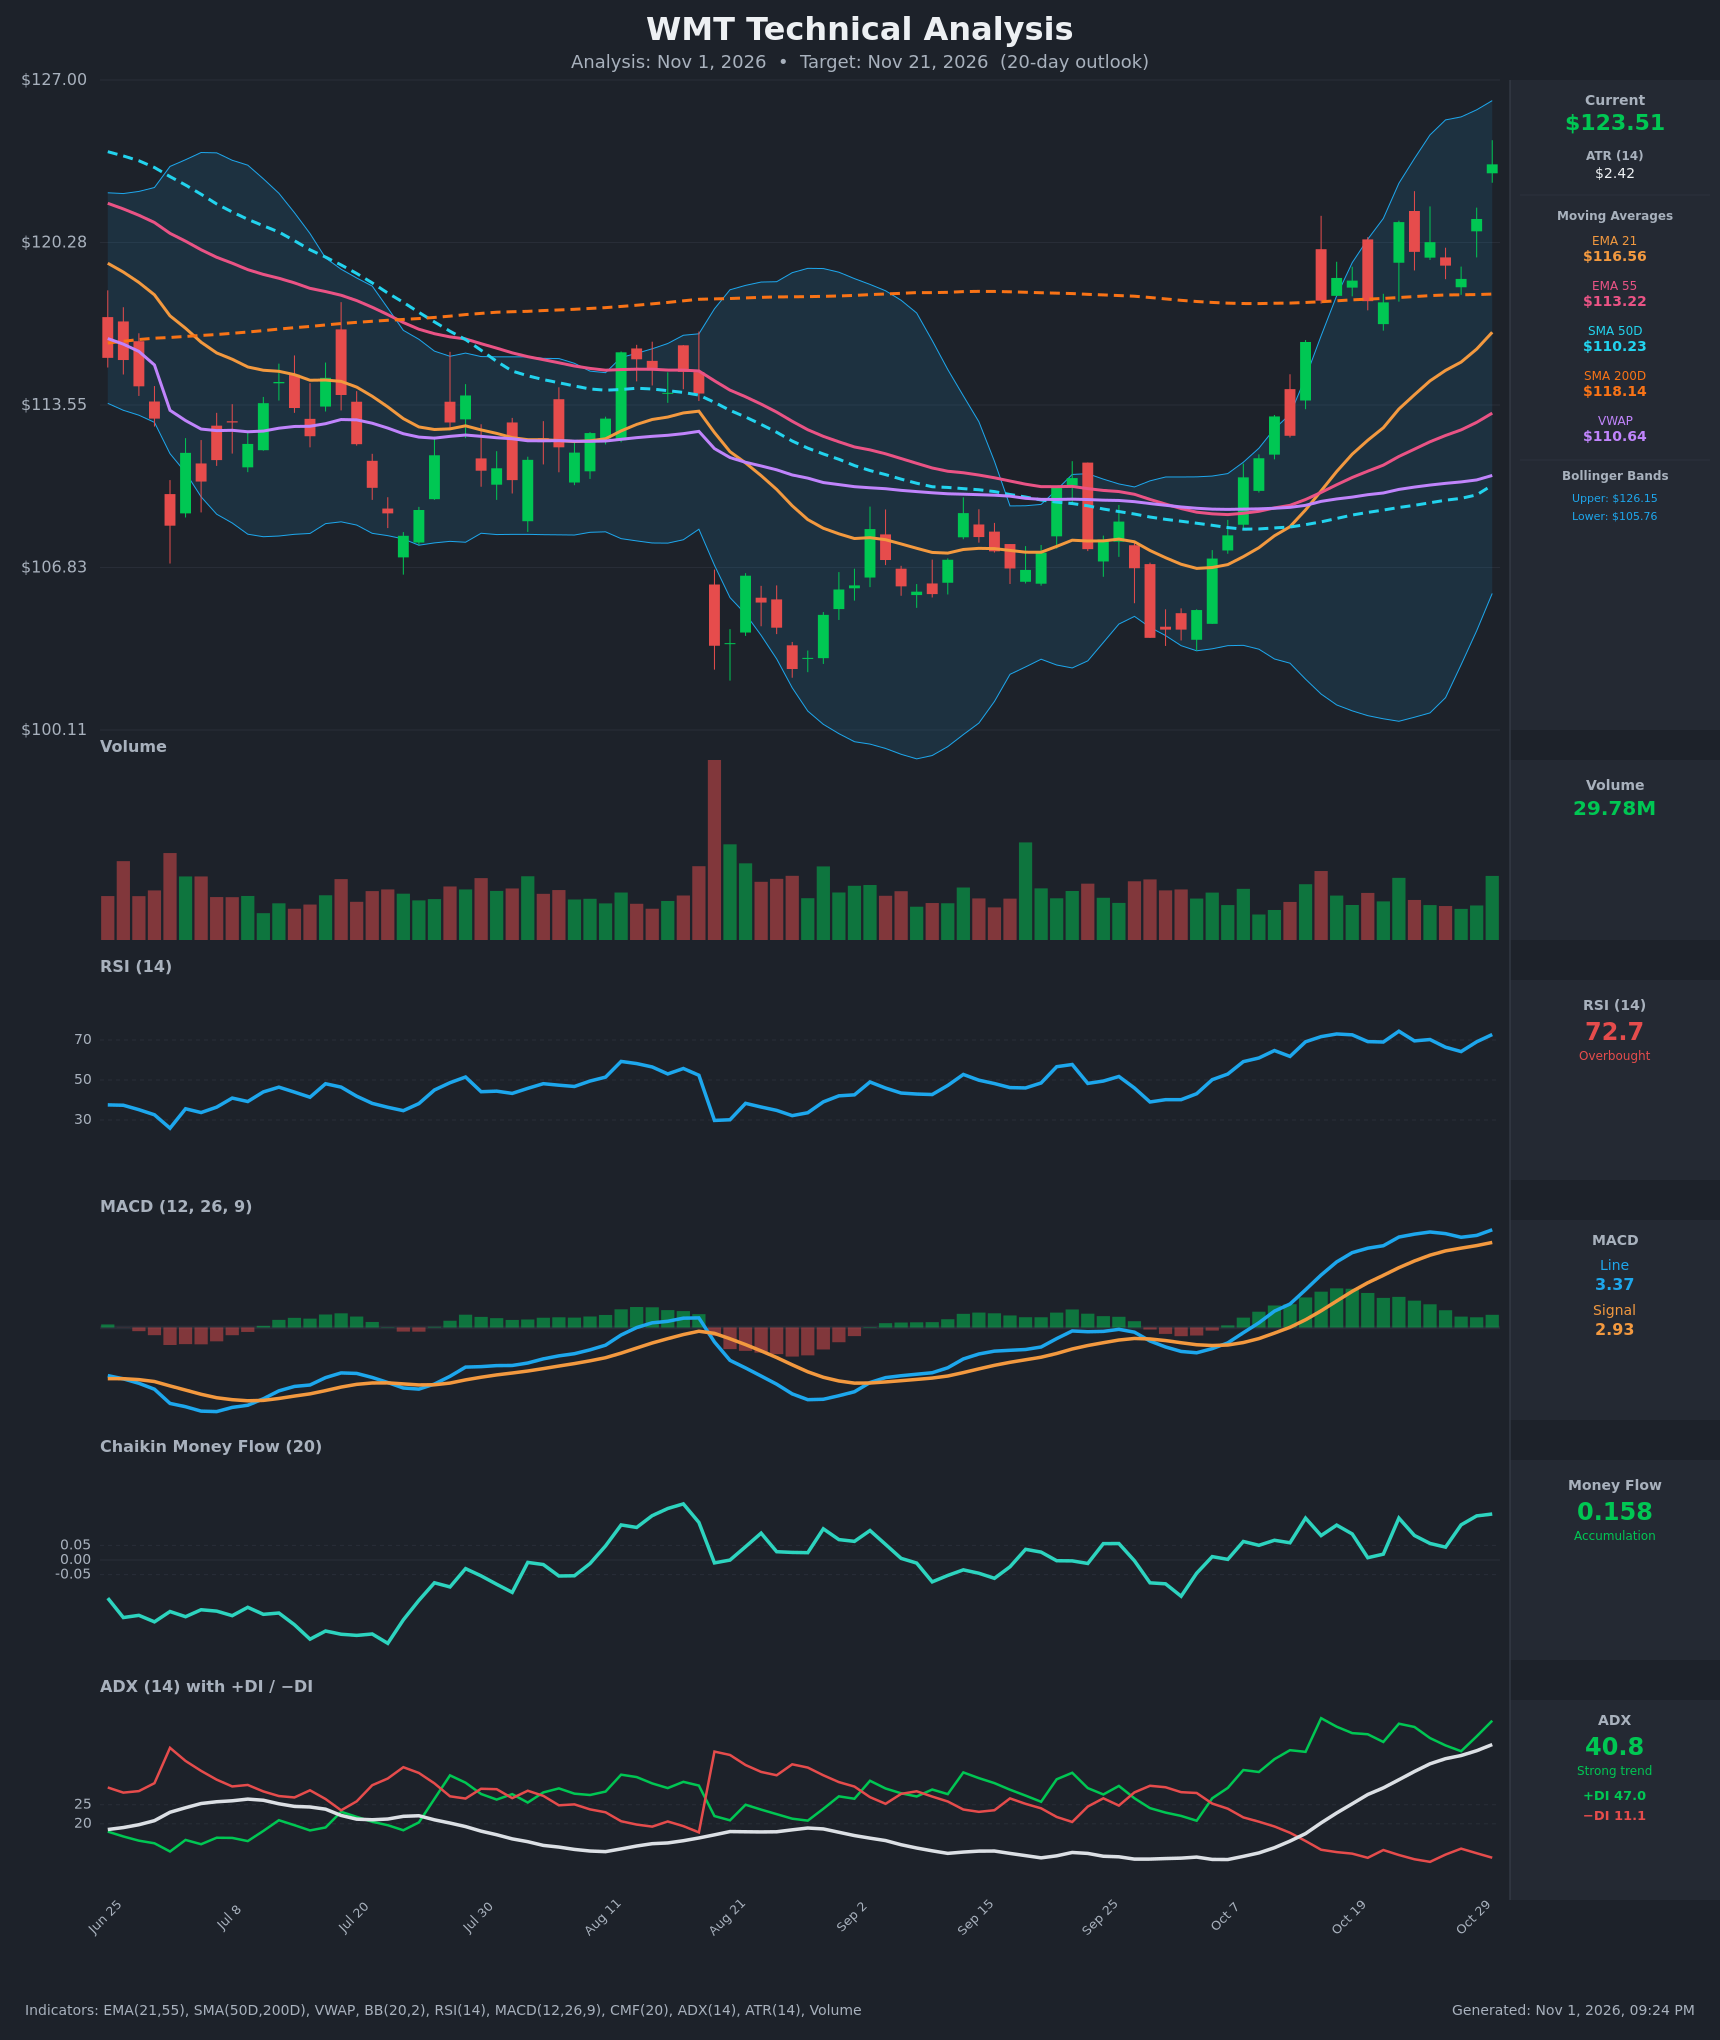
- RSI (14): 72.74, overbought, but it has held in a 64-74 band since mid-October rather than rolling over. It is rising again after the Oct 28 dip to 64. This is typical of strong trends, though it leaves the stock vulnerable to a short-term pullback. [Bullish]
- 20 EMA: The data gives EMA 21 at $116.56, and price at $123.51 is about 6% above it. The EMA is rising steeply and sits above EMA 55 ($113.22), a crossover that occurred around Oct 15. Price is far above the average, which signals strength but also extension. [Bullish]
- MACD: Line 3.37 is above signal 2.93, with a positive histogram of about +0.44 that is re-expanding after a brief contraction on Oct 27-28. The bullish crossover dates to Oct 13 and both lines are well above zero. [Bullish]
- Bollinger Bands (20): Upper $126.15, lower $105.76, so the bands are wide at about $20. Price is in the upper quarter of the band, about $2.64 below the upper band. Price has been riding the upper half since the early-October breakout, which is a sign of trend strength rather than a reversal signal on its own. [Bullish]
- CMF (20): 0.158, well above the +0.05 threshold. It has been positive for the whole recent window, which points to sustained buying pressure. [Accumulation]
- ADX (14): 40.8 and rising steadily from 13.7 on Oct 12. +DI is 47.0, far above −DI at 11.1. This is a very strong, mature uptrend with bulls firmly in control. An ADX above 40 can also precede trend exhaustion. [Strong Trend + Bullish]
- Volume: 29.78M on a green candle, one of the higher readings in recent weeks and above the surrounding bars. The breakout to a new swing high is backed by rising participation. Price is also well above VWAP ($110.64). [Bullish – confirms breakout]
DIVERGENCES & TRENDS
- Mild RSI divergence: Price made a higher high at $123.51, but RSI at 72.7 is slightly below the Oct 22 peak of 74.4. This is a minor warning of momentum fatigue, not a confirmed divergence. MACD, CMF and ADX are all making higher highs and show no divergence.
- Moving-average structure: Price has reclaimed SMA200 ($118.14) after trading below it for much of Aug-Sep. EMA21 is above EMA55, and the +DI/−DI and MACD crossovers are all bullish.
- No golden cross yet: SMA50 ($110.23) is still below SMA200 ($118.14). It is rising and the gap is narrowing, so a golden cross is a potential longer-term catalyst.
- Extension: Price is about 6% above EMA21 and nearly 12% above VWAP. This raises the odds of consolidation or a pullback toward $118-121 even within an uptrend.
- Oct 22-28 digestion: Price held the $118-121 area, then broke out above it on Oct 29-30.
CHART PATTERNS
- Bullish Double Bottom: Lows near $103-104 in late Aug and early Oct, with a neckline around $118-119 that coincides with SMA200. Price has now cleared that neckline. The measured move is about $15 (neckline to low), which projects to roughly $133. That is a longer-horizon target, and only part of it is likely within 20 days.
- Bullish Flag / consolidation: The tight Oct 22-28 range of about $118-121 after the sharp rally resolved upward with the breakout to $123.51. The flagpole of about $10 projects to roughly $130.
- No bearish reversal pattern (double top, rising wedge) is visible at present.
POTENTIAL SCENARIOS
- Scenario 1: Bullish Trend Continuation — The double-bottom neckline breakout and flag resolution extend higher, with a brief pause near the upper Bollinger Band. Trigger: a daily close above $126.15 on solid volume. Target: $128-131. Invalidation: a daily close below $119.50. (50% probability)
- Scenario 2: Bearish Overbought Pullback — RSI above 70 with price extended 6% over the EMA21 prompts profit-taking and a mean-reversion move that fills the breakout zone. Trigger: a close below $120.00 with MACD histogram turning negative. Target: $116.50-118.00 (EMA21 and SMA200 zone). Invalidation: a recovery above $124.50. (30% probability)
- Scenario 3: Neutral Consolidation — Price digests the rally between $120 and $126 as the moving averages catch up. Trigger: failure at the upper Bollinger Band and RSI cooling toward 60 without breaking support. Target: $121-125. Invalidation: a close outside the $119.50-$127 range. (20% probability)
PRICE TARGETS
- Target Price: $126.50 (20-day horizon, Nov 21, 2026)
- Expected Range: $118.00 to $131.00 (width $13.00, about 10.5% of current price, consistent with the 14-21 day guidance and ATR-based volatility of about $2.42 per day)
- Key Levels: Support at $120.00 (prior consolidation top, with SMA200 at $118.14 beneath it), Resistance at $126.15 (upper Bollinger Band, then $127-128)
OVERALL BIAS
OVERALL BIAS: BULLISH - ADX at 40.8 with +DI far above −DI, a MACD above signal, CMF accumulation, and a volume-backed breakout above SMA200 and the double-bottom neckline favor continuation. Overbought RSI and price extension suggest the gains may come with a pullback or consolidation along the way, so conviction is moderate.
This is educational analysis and not financial advice.