BB 27-day bearish forecast — Nov 1, 2026
- Bias: Bearish
- Timeframe: 27 days (made Nov 1, 2026, target date Nov 27, 2026)
- Price at analysis: $8.42
- Price target: $8.10
- Expected range: $7.50 – $8.95
- Result: Pending — graded after the close on Nov 27, 2026
Get a free AI analysis of BB today
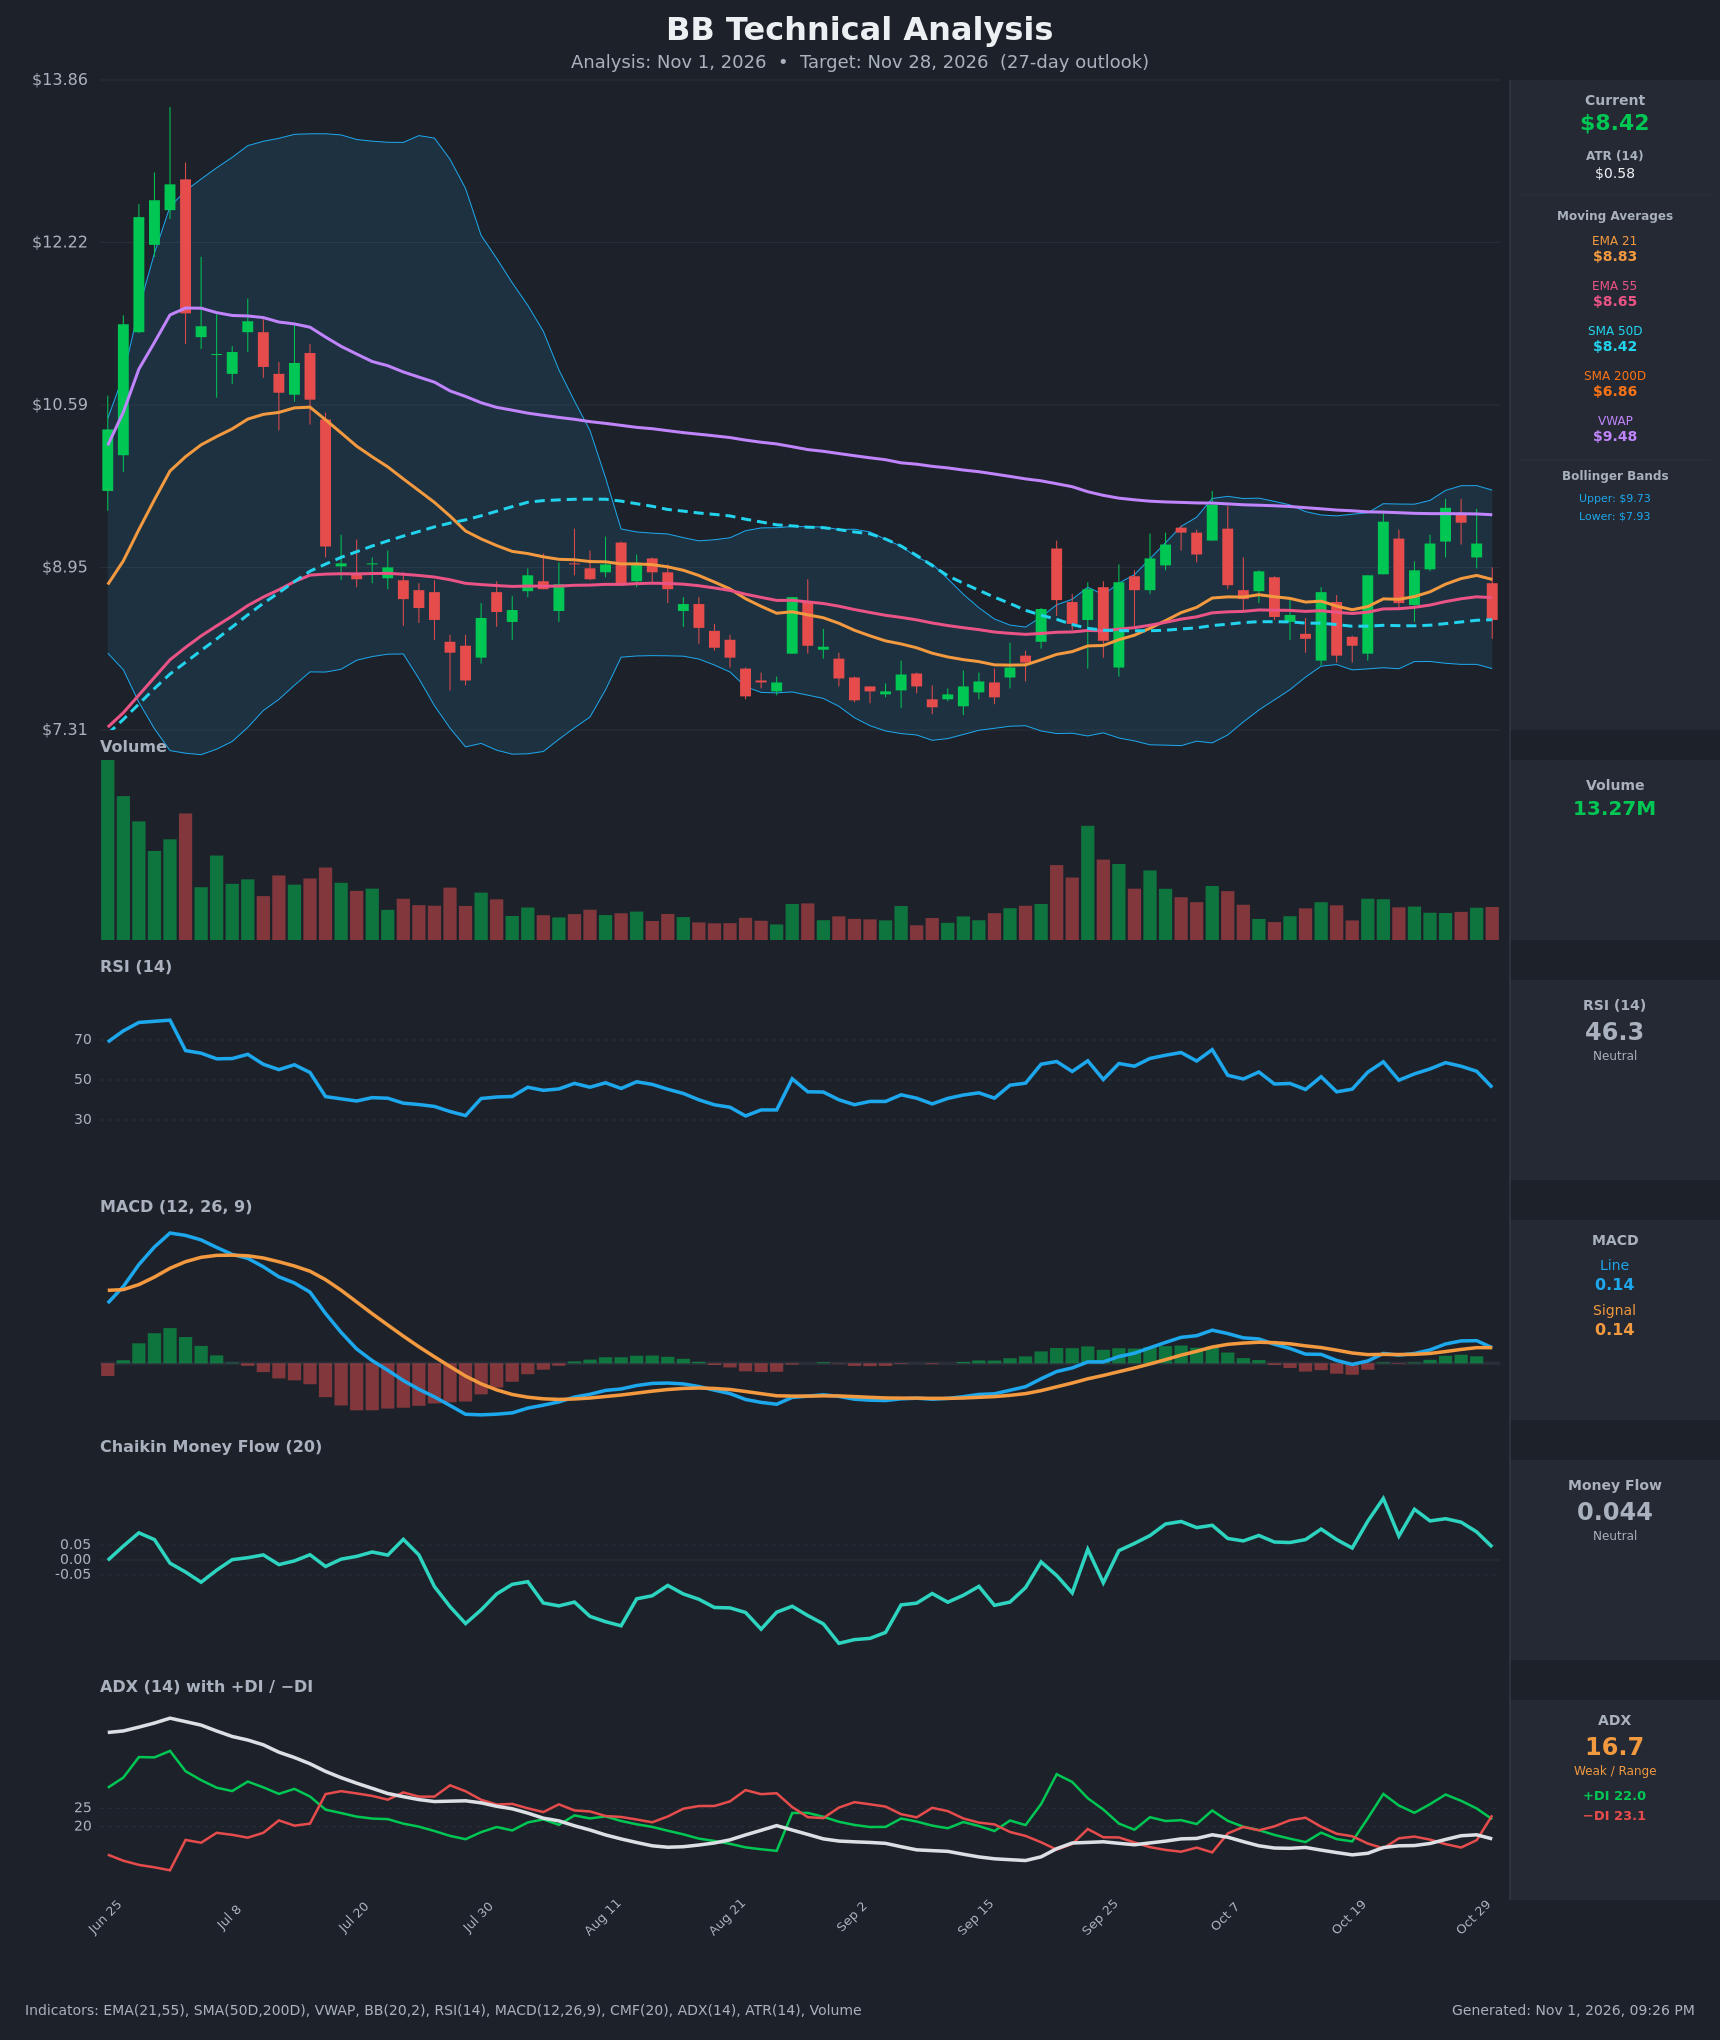
Analysis
TECHNICAL INDICATORS
- RSI (14): 46.29, down from 54.4 two bars ago and 59 on Oct 21. It has rolled below the 50 midline after failing near 60, so momentum is fading, though it is not oversold. [Bearish]
- 20 EMA (EMA 21 = $8.83): Price at $8.42 sits about 4.6% below the EMA21, which now acts as resistance. It also closed below EMA55 ($8.65). EMA21 is still above EMA55, so there is no bearish EMA crossover yet, but the gap is narrowing. [Bearish]
- MACD: Line 0.1369 vs Signal 0.1373, a flat-to-bearish crossover happening right now. The line fell from 0.199 to 0.137 in one bar, so the histogram has flipped to roughly zero or slightly negative after a positive run. [Bearish]
- Bollinger Bands (20): Upper $9.73, lower $7.93, with the midline near $8.83. Price fell from the upper half to below the midline. Bandwidth is moderate and the range is stable, so there is room to drift toward the lower band at $7.93. [Bearish]
- CMF (20): 0.044, inside the neutral band (±0.05) and falling from 0.207 on Oct 21. Accumulation is fading, but there is no distribution yet. [Neutral]
- ADX (14): 16.7, which is weak and range-bound. +DI is 22.0 and −DI is 23.1, so −DI has just crossed back above +DI (bears marginally in control). Direction is leaning bearish, but trend strength is poor. [Weak Trend, Bearish lean]
- Volume: 13.27M, average to slightly above average, on an 8% one-day drop. Down-bar volume is not heavy, but the sharp reversal candle shows rejection near $9.2–9.5. [Mild Bearish]
Moving-average context:
- SMA50D ($8.42): Price is sitting right on it, so this is the immediate test.
- SMA200D ($6.86): Price is well above it, which keeps the long-term structure intact.
- VWAP ($9.48): Price is well below it, which signals overhead supply.
- SMA50D / SMA200D: The SMA50D is above the SMA200D, so there is no death cross.
DIVERGENCES & TRENDS
- There is no clear RSI or MACD divergence. Price made a higher high on Oct 27 ($9.55), and RSI (58.7) and MACD (0.170) confirmed it, then both turned down sharply.
- MACD has gone from a bullish climb (0.020 → 0.199) to a flat crossover, and RSI has fallen from 59 to 46 in under two weeks. This is a momentum rollover.
- Since Oct 29, +DI has fallen from 28.7 to 22.0 and −DI has risen from 14.3 to 23.1, a bearish DI crossover. ADX remains under 20, so this is a lean, not a trend.
- CMF has declined from a 0.207 peak to 0.044, a gradual loss of buying pressure.
- Price has failed repeatedly at VWAP and the $9.4–9.7 zone, which also lines up with the upper Bollinger Band. It has since closed below EMA21 and EMA55 and is testing the SMA50.
CHART PATTERNS
- Bearish Double Top (reversal): Peaks at $9.41 (Oct 21) and $9.55 (Oct 27), with an interim trough near $8.59 and the neckline around $8.4–$8.6. The latest close at $8.42 is a break of that neckline. The measured move (height ≈ $1.0) points to about $7.50, which matches the September lows.
- Broader range: Price has been mostly bounded between about $7.50 and $9.50 since August, a loose rectangle. This tempers the double-top target, since the lower end of the range ($7.5–$7.9) is a major demand zone.
- The weak ADX argues against a sustained trend, so I expect a drift lower toward the middle-to-lower part of the range rather than a collapse.
POTENTIAL SCENARIOS
- Scenario 1: Bearish Double-Top Breakdown — The neckline and SMA50 at $8.42 fail, and price grinds toward the lower Bollinger Band and the prior range lows. Trigger: daily close below $8.30 with MACD going negative. Target: $7.90–$8.10, with an extension to $7.50. Invalidation: daily close above $8.83 (EMA21). (50% probability)
- Scenario 2: Neutral Range Chop — Price holds the SMA50 and EMA55 zone and oscillates between about $8.00 and $8.90 on weak ADX and neutral CMF. Trigger: bounce from $8.40 that stalls under EMA21. Target: $8.30–$8.60. Invalidation: close outside $7.90–$8.95. (28% probability)
- Scenario 3: Bullish Reclaim — Dip buyers defend the SMA50, and price reclaims EMA21 and heads back toward VWAP and the upper band. Trigger: close above $8.83 with MACD re-crossing up and CMF above 0.05. Target: $9.30–$9.50. Invalidation: close below $8.20. (22% probability)
PRICE TARGETS
For the 27-day horizon, the expected range is $7.50 to $8.95, a $1.45 width, or about 17.2% of the current price. This is consistent with the 12–18% guidance for 30–60 days, scaled slightly down for 27 days.
- Target Price: $8.10 (about −3.8% from $8.42)
- Expected Range: $7.50 to $8.95
- Key Levels: Support at $7.93 (lower Bollinger Band), Resistance at $8.65 (EMA55), with further resistance at $8.83 (EMA21)
OVERALL BIAS
OVERALL BIAS: BEARISH - Price has closed below EMA21 and EMA55 and is breaking a double-top neckline, with a bearish MACD crossover, a bearish DI flip, RSI rolling over below 50, and rejection at VWAP and the $9.5 area. The weak ADX and the SMA200 far below limit the downside, so the target is a measured drift to about $8.10.
This is educational analysis and not financial advice.