KWEB 27-day bearish forecast — Nov 1, 2026
- Bias: Bearish
- Timeframe: 27 days (made Nov 1, 2026, target date Nov 27, 2026)
- Price at analysis: $22.74
- Price target: $22.20
- Expected range: $20.80 – $24.10
- Result: Pending — graded after the close on Nov 27, 2026
Get a free AI analysis of KWEB today
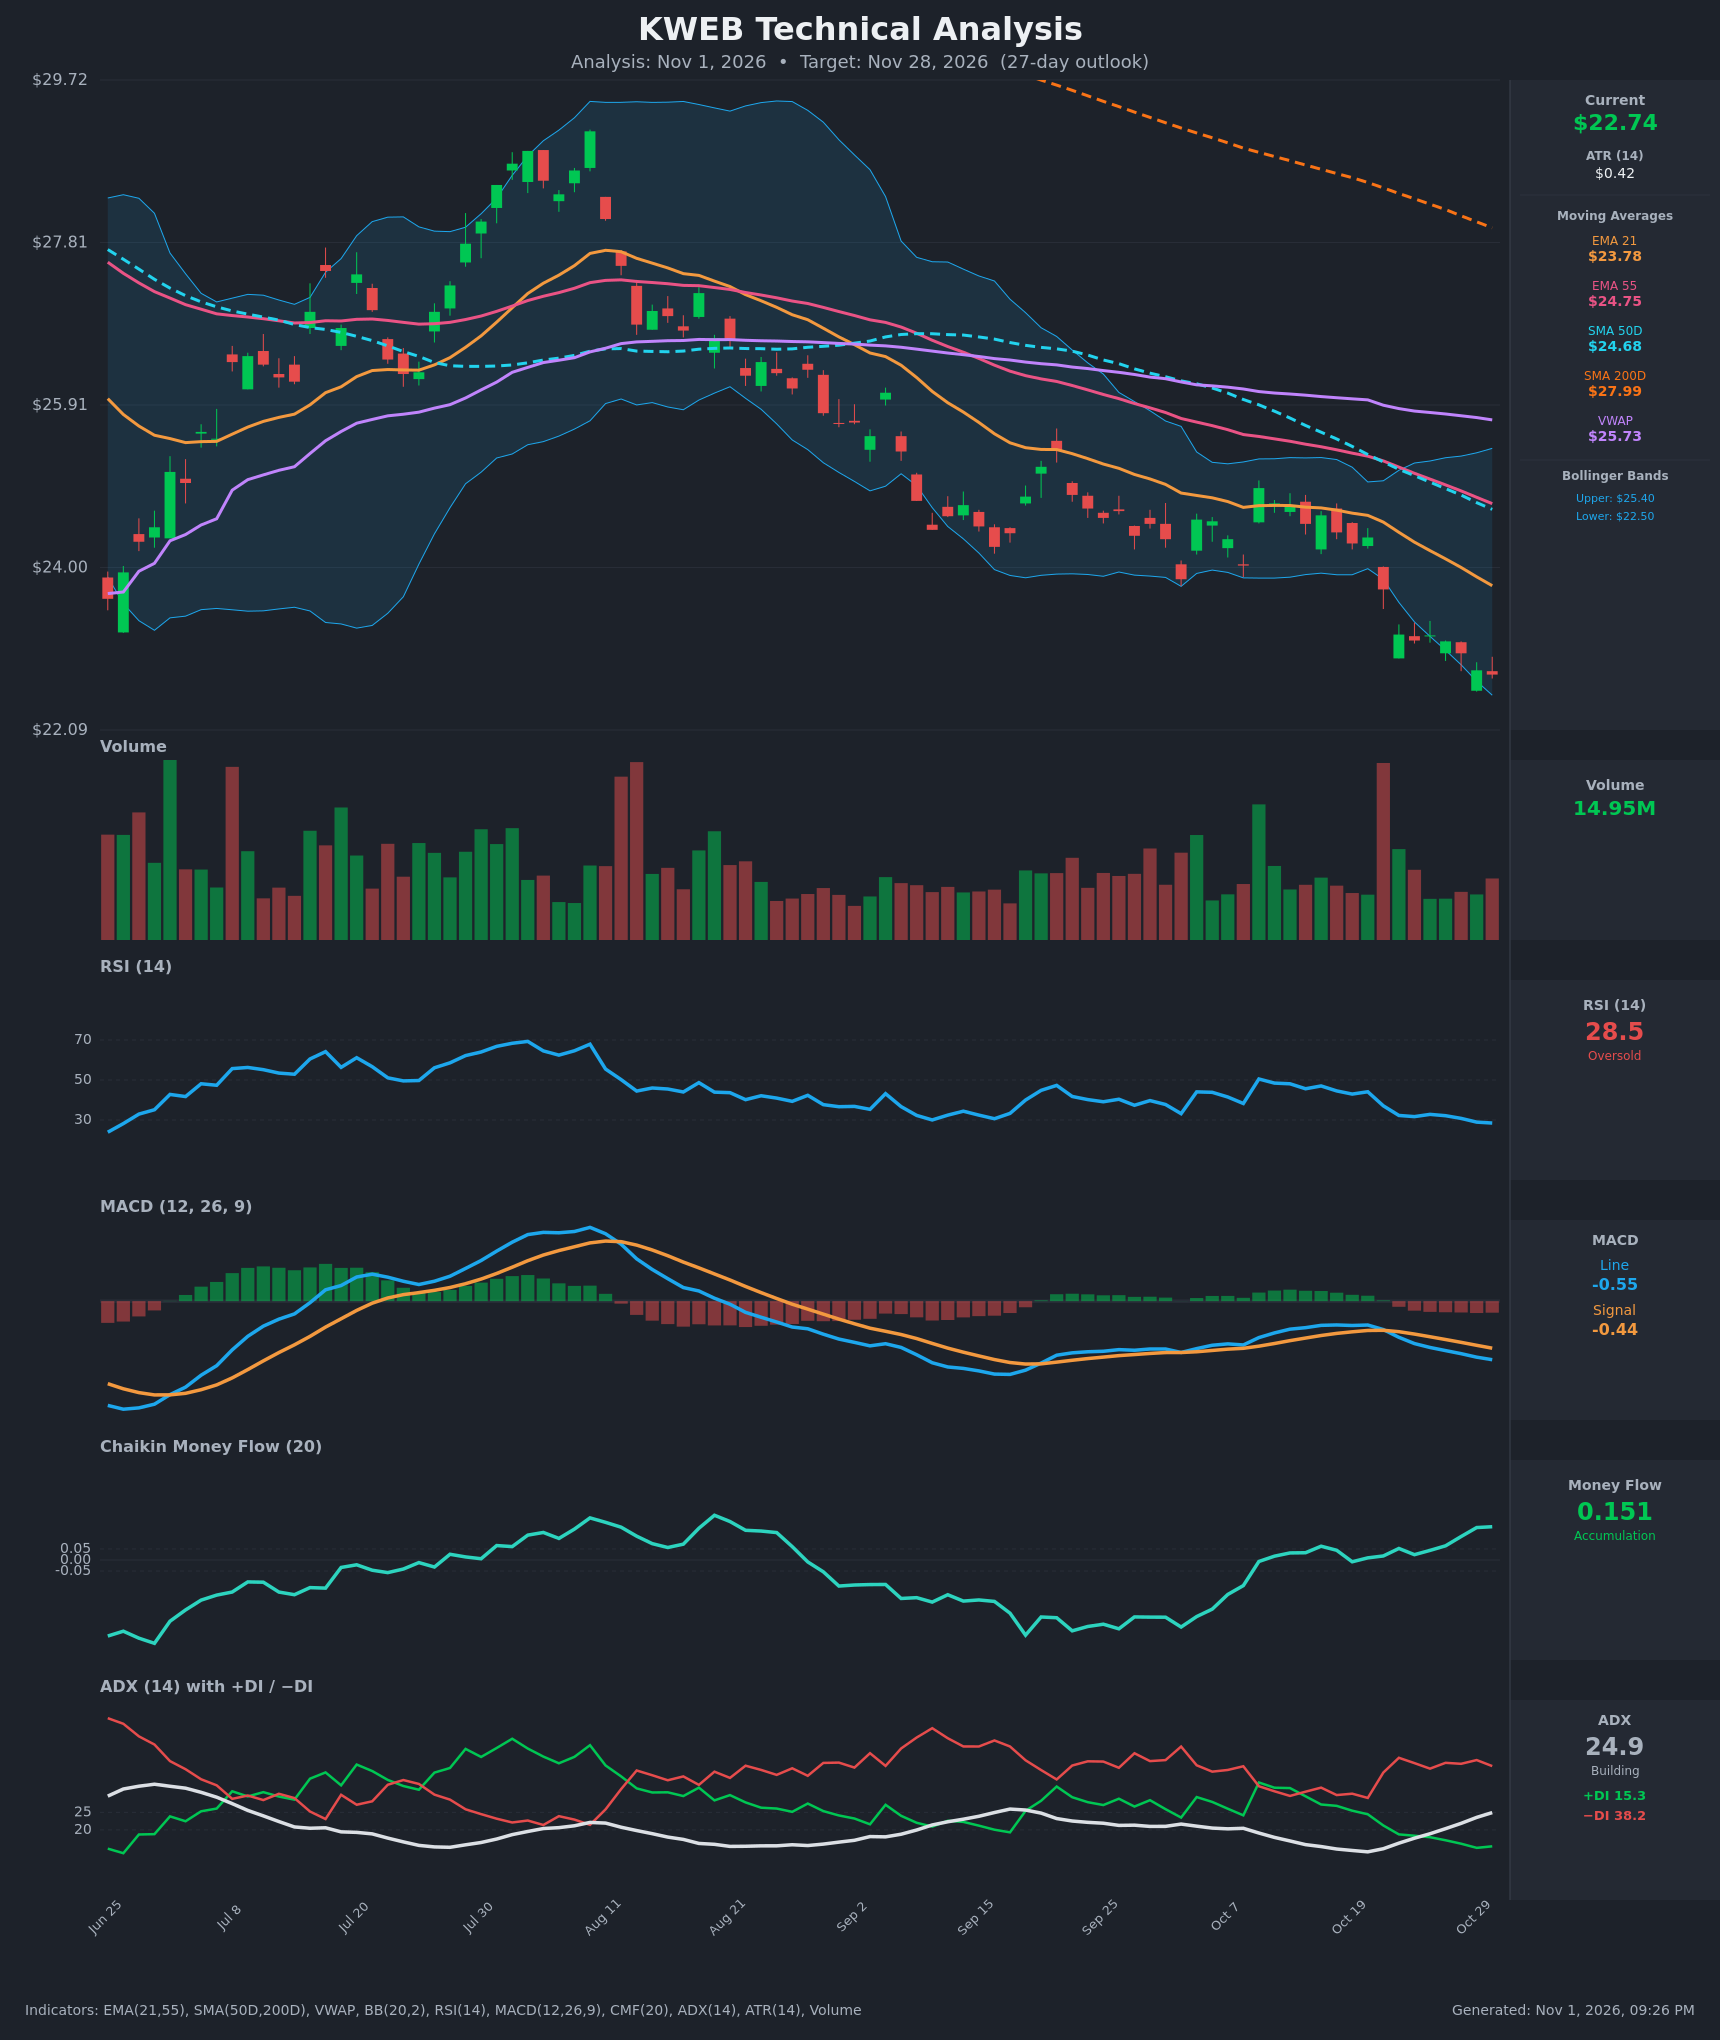
Analysis
TECHNICAL INDICATORS
- RSI (14): 28.48, in oversold territory (<30) and down from about 48 on Oct 13. It has fallen steadily with lower highs since the Oct 7 peak near 50. It is oversold but has not yet turned up, so there is no bounce confirmation. [Bearish]
- 20 EMA: EMA21 is $23.78 and falling, and EMA55 is $24.75. Price at $22.74 is about 4.4% below the EMA21, which is now overhead resistance. EMA21 is below EMA55 and the gap is widening. [Bearish]
- MACD: Line -0.550 is below Signal -0.442, and the histogram is negative and expanding. The bearish crossover happened around Oct 21-22 and the spread has widened every day since. Momentum is still deteriorating. [Bearish]
- Bollinger Bands (20): Upper $25.40, lower $22.50. Price sits just above the lower band after riding it for several sessions. The bands are widening downward, which signals a trend walk rather than a squeeze. A close below $22.50 would confirm continuation, while a snap-back inside the bands would signal an oversold bounce. [Bearish]
- CMF (20): +0.151 and rising from -0.008 on Oct 19, well above the +0.05 threshold. This is accumulation while price makes new lows, a bullish divergence. It is the main counter-argument to the downtrend. [Accumulation]
- ADX (14): 24.9 and rising (from 13.7 on Oct 20), right at the strong-trend threshold. −DI at 38.2 is far above +DI at 15.3, so sellers are firmly in control. The trend is strengthening to the downside. [Strong Trend – Bearish]
- Volume: 14.95M, near average on the latest bar. The big breakdown bar around Oct 21 came on heavy volume, and the follow-through selling has been on lighter volume. That slightly suggests selling exhaustion, but there is no capitulation spike yet. [Neutral to mildly Bearish]
DIVERGENCES & TRENDS
- Bullish CMF divergence: price is at a new low (about $22.74) while CMF has climbed to its highest reading in the window (0.151). Buyers are absorbing the selling, which raises the odds of a relief bounce.
- RSI: there is no bullish RSI divergence yet. RSI at 28.5 is making a lower low alongside price, so it confirms the move.
- Moving averages: a death cross is already in place (SMA50D $24.68 below SMA200D $27.99). Price is below the 21 EMA, 55 EMA, SMA50, VWAP ($25.73) and SMA200, a fully bearish stack.
- MACD: it crossed below Signal around Oct 21-22 and the gap is widening.
- DI: −DI crossed above +DI around Oct 14-15 and the gap has since widened sharply (38.2 vs 15.3).
- Range break: price broke below the $23.9-24.5 consolidation floor on Oct 21-22 with volume.
CHART PATTERNS
- Descending Triangle / range breakdown (reference diagram): price consolidated around $23.9-$25 through Sep-Oct, then broke below the flat support near $23.9. The measured move of about 1.3 points projects to roughly $22.5-$22.6, which has essentially been reached. Further downside needs fresh selling.
- Bearish continuation structure: the Aug-Oct decline is a series of lower highs and lower lows below a declining SMA200. This favors continuation unless price reclaims $23.78.
- Potential Bullish Falling Wedge: if price decelerates and compresses between falling trendlines with CMF still rising, it could form this reversal. It is not confirmed, because the recent drop is steep rather than converging.
- Oversold reversion: a bounce targeting the EMA21 near $23.78 is the plausible upside if the CMF divergence resolves.
POTENTIAL SCENARIOS
- Scenario 1: Bearish Trend Continuation — Sellers keep control with −DI dominant, ADX pushing above 25 and a widening MACD gap. Price walks the lower Bollinger Band and makes new lows. Trigger: daily close below $22.50 (lower BB) and the ~$22.09 chart low. Target: $21.00-$22.00. Invalidation: daily close above the EMA21 at $23.78. (45% probability)
- Scenario 2: Bullish Oversold Relief Bounce — RSI at 28 combined with rising CMF (0.151) triggers mean reversion back toward the falling EMA21. The rally would likely fail below the EMA55 and SMA50 cluster. Trigger: close back above $23.20 with a rising RSI and MACD histogram contraction. Target: $23.80-$24.20. Invalidation: close below $22.00. (40% probability)
- Scenario 3: Neutral Basing Range — Price chops between $22.00 and $23.50 as selling exhausts and no catalyst emerges. Trigger: a series of inside days with ADX flattening. Target: $22.50-$23.30. Invalidation: close outside $21.80-$23.80. (15% probability)
PRICE TARGETS
- Target Price: $22.20 (27 days, Nov 28, 2026)
- Expected Range: $20.80 to $24.10. The width is $3.30, or about 14.5% of the current price, which fits the 30-60 day-style band (12-18%) for a 27-day horizon.
- Key Levels: Support at $22.00, Resistance at $23.78
OVERALL BIAS
OVERALL BIAS: BEARISH - Price is below every moving average after a death cross, −DI (38.2) dominates +DI (15.3) with ADX rising toward 25, and MACD is widening below its signal. The oversold RSI and rising CMF raise the odds of a relief bounce, but the trend evidence outweighs them. Reclaiming the EMA21 at $23.78 would negate the bearish case.
This is educational analysis and not financial advice.