IWM 27-day bullish forecast — Nov 1, 2026
- Bias: Bullish
- Timeframe: 27 days (made Nov 1, 2026, target date Nov 27, 2026)
- Price at analysis: $279.33
- Price target: $285.00
- Expected range: $263.00 – $300.00
- Result: Pending — graded after the close on Nov 27, 2026
Get a free AI analysis of IWM today
Analysis
TECHNICAL INDICATORS
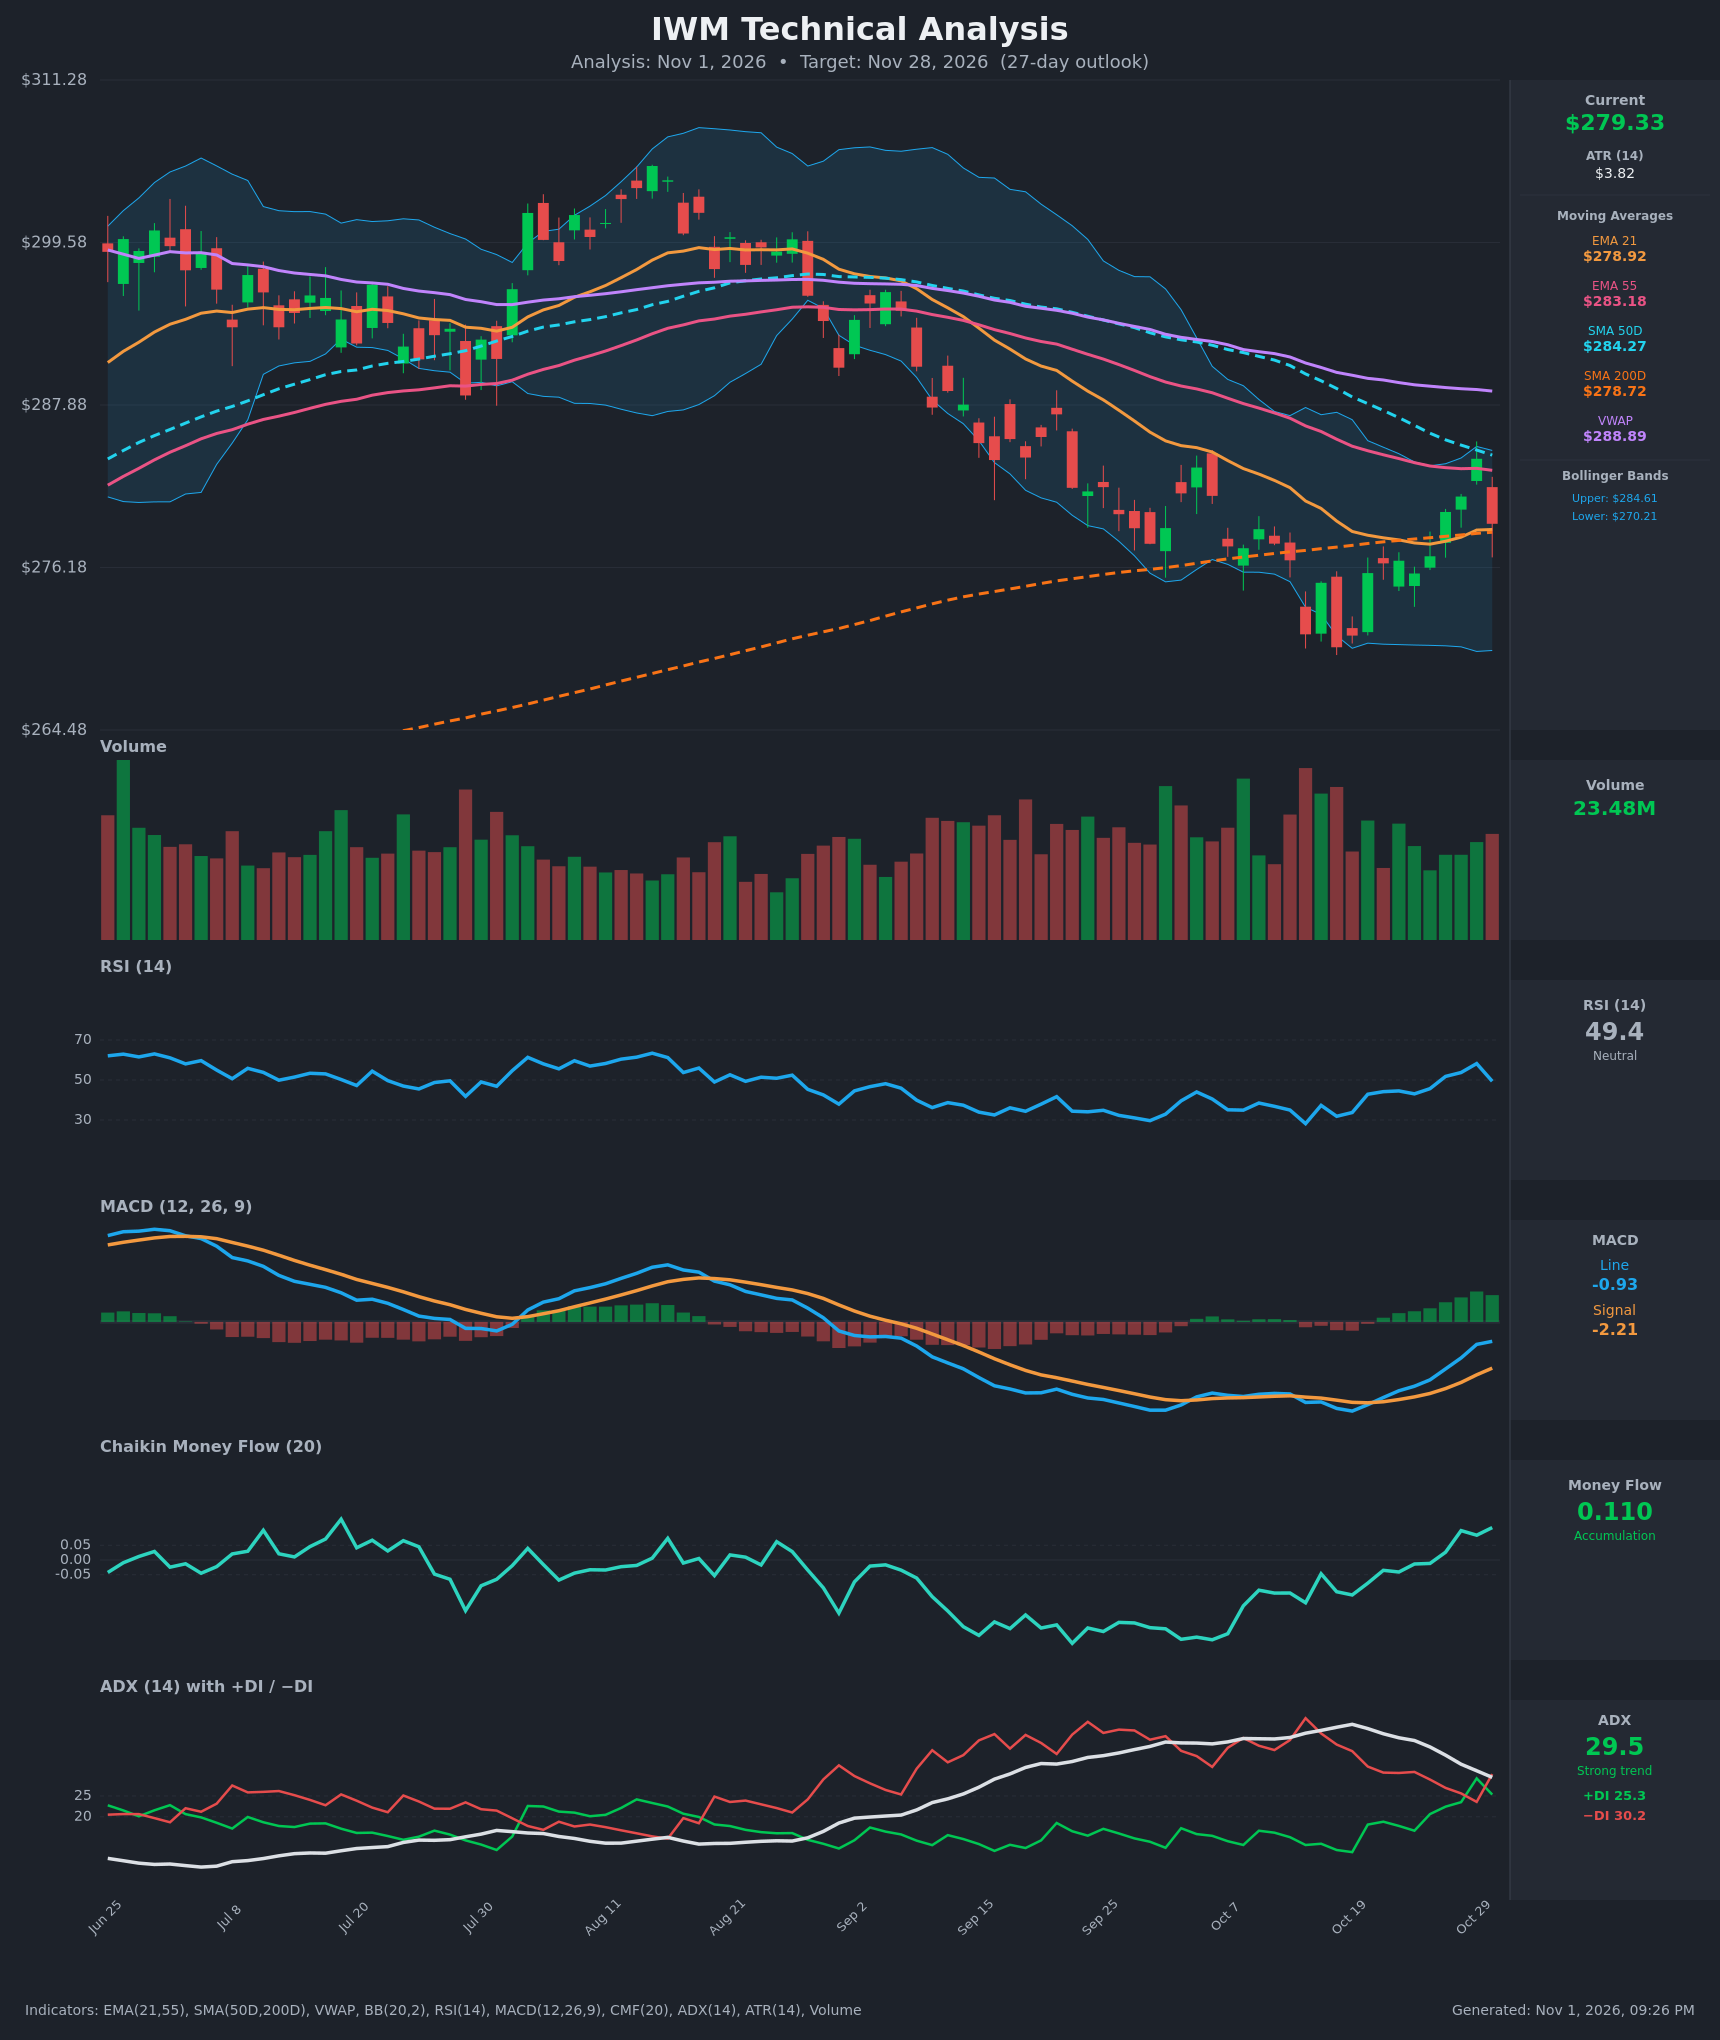
- RSI (14): 49.38, neutral. It fell from 58.2 on Oct 29 after the rejection candle, but it has recovered from the 28 oversold low on Oct 14. The sequence of higher lows (28 → 32 → 49) shows momentum repairing. [Neutral]
- 20 EMA: EMA21 is $278.92, and price at $279.33 sits just above it. EMA21 has turned upward from $277.86. It remains below EMA55 ($283.18), so there is no bullish EMA cross yet. [Neutral]
- MACD: The line (-0.93) is above the signal (-2.21), and the histogram is positive and expanding. The bullish crossover occurred around Oct 20-21. Both lines are still below zero, so this is a recovery rather than a confirmed trend change. [Bullish]
- Bollinger Bands (20): Upper is $284.61 and lower is $270.21, with the midline near $277.4. Price rode from the lower band (the ~$270 low) to the upper band and was rejected on the last candle. It is now above the midline. The bounce stalled at the band top, which also lines up with SMA50 and EMA55. [Neutral]
- CMF (20): 0.110, above +0.05 and rising from -0.14 in mid-October. Buying pressure is building on the bounce, and this is the strongest accumulation reading in months. [Accumulation]
- ADX (14): 29.5 and falling from a 42 peak, so the prior downtrend is losing strength. −DI (30.2) is still above +DI (25.3), and +DI just rolled over on the last bar. Bears retain nominal control, but it is fading. [Strong but weakening trend – Bearish bias fading]
- Volume: 23.48M, about average. The last candle was red on near-average volume, so the rejection lacks heavy distribution. The recent bounce came on moderate, unspectacular volume, with no capitulation spike on the upside. [Neutral]
Moving-average context:
- Price is $279.33, against SMA200 at $278.72 (barely above) and SMA50 at $284.27 (below).
- VWAP at $288.89 is overhead resistance.
- SMA50 is converging toward SMA200 (a $5.5 gap, narrowing daily). A death cross is a risk if price loses the 200.
DIVERGENCES & TRENDS
- Bullish divergence: Price made its Oct 16 low (~$270) near the Oct 14 low, while RSI (31.9 vs 28.2) and CMF rose. MACD made a higher low as well. This supports a base.
- The MACD bullish crossover and the histogram flip to positive came while price was still below the major MAs, an early reversal signal.
- ADX is down from 42 to 29.5 while −DI has fallen from 43.7 to 30.2, so selling pressure is exhausting.
- Caution: The last candle was a rejection at the SMA50/EMA55/upper-BB cluster ($283–285). +DI fell from 29.2 to 25.3 and −DI rose from 23.6 to 30.2 in two sessions. RSI dropped 9 points in a day.
- Price is stuck at the SMA200 and EMA21 convergence (~$278.7–278.9), the pivot level. A close below it would weaken the base thesis.
CHART PATTERNS
- Bullish Double Bottom (developing): The lows around Oct 14 and Oct 16 (~$270–271) form the two troughs, with a neckline near $284–285 (the Oct 29 high). The pattern is only confirmed on a close above ~$285. The measured move is roughly the pattern depth (~$14), giving ~$298, which coincides with the prior August–September breakdown area (~$295–300).
- Alternative reading: The larger structure from September is a descending channel, and the bounce toward $284 could be a retest of broken support (the SMA50, EMA55 and VWAP stack). If the neckline fails, the bearish continuation of the downtrend takes price back to $270.
- The pattern is incomplete and the last candle was a rejection, so the target is conservative relative to the pattern measure.
POTENTIAL SCENARIOS
- Scenario 1: Bullish Double-Bottom Breakout — Price holds the SMA200/EMA21 pivot, the MACD recovery continues and CMF accumulation persists, driving a break of the $284–285 resistance cluster (SMA50, EMA55, upper BB). Trigger: daily close above $285 on rising volume. Target: $290–293 (VWAP at $289, then the measured move toward $298 as an extension). Invalidation: daily close below $270. (45% probability)
- Scenario 2: Bearish Rejection and Trend Resumption — The last-candle rejection at the MA cluster marks a lower high. −DI stays above +DI, the SMA200 gives way, and a death cross looms as SMA50 falls toward SMA200. Trigger: daily close below $278.70, then below $275. Target: $270 (lower BB and October lows), with an extension to $265. Invalidation: close above $285. (35% probability)
- Scenario 3: Neutral Range Chop — Price oscillates between the SMA200 support (~$278.7) and the SMA50 resistance (~$284.3), with falling ADX. Trigger: failure of both breakout and breakdown triggers. Target: $276–$284. Invalidation: close outside $270–$286. (20% probability)
PRICE TARGETS
- Target Price: $285.00 (27-day horizon, about +2.0%)
- Expected Range: $263.00 to $300.00 (width $37.00, about 13.2% of current price, consistent with the 12–18% guidance for 30–60 days, scaled for 27 days)
- Key Levels: Support at $278.72 (SMA200, with $270.21 lower BB and the ~$270 October lows as major support below), Resistance at $284.27 (SMA50, with EMA55 at $283.18 and the upper BB at $284.61 in the same zone; VWAP at $288.89 above)
OVERALL BIAS
OVERALL BIAS: BULLISH - A developing double bottom, a positive MACD crossover, CMF accumulation (0.110), and a fading ADX/−DI downtrend support a modest upside drift toward the $285+ resistance cluster. Conviction is moderate because the last candle was a rejection at the SMA50/EMA55 stack and −DI still leads, so the SMA200 at $278.72 must hold.
This is educational analysis and not financial advice.