BAC 27-day bullish forecast — Nov 1, 2026
- Bias: Bullish
- Timeframe: 27 days (made Nov 1, 2026, target date Nov 27, 2026)
- Price at analysis: $50.01
- Price target: $51.80
- Expected range: $47.60 – $54.20
- Result: Pending — graded after the close on Nov 27, 2026
Get a free AI analysis of BAC today
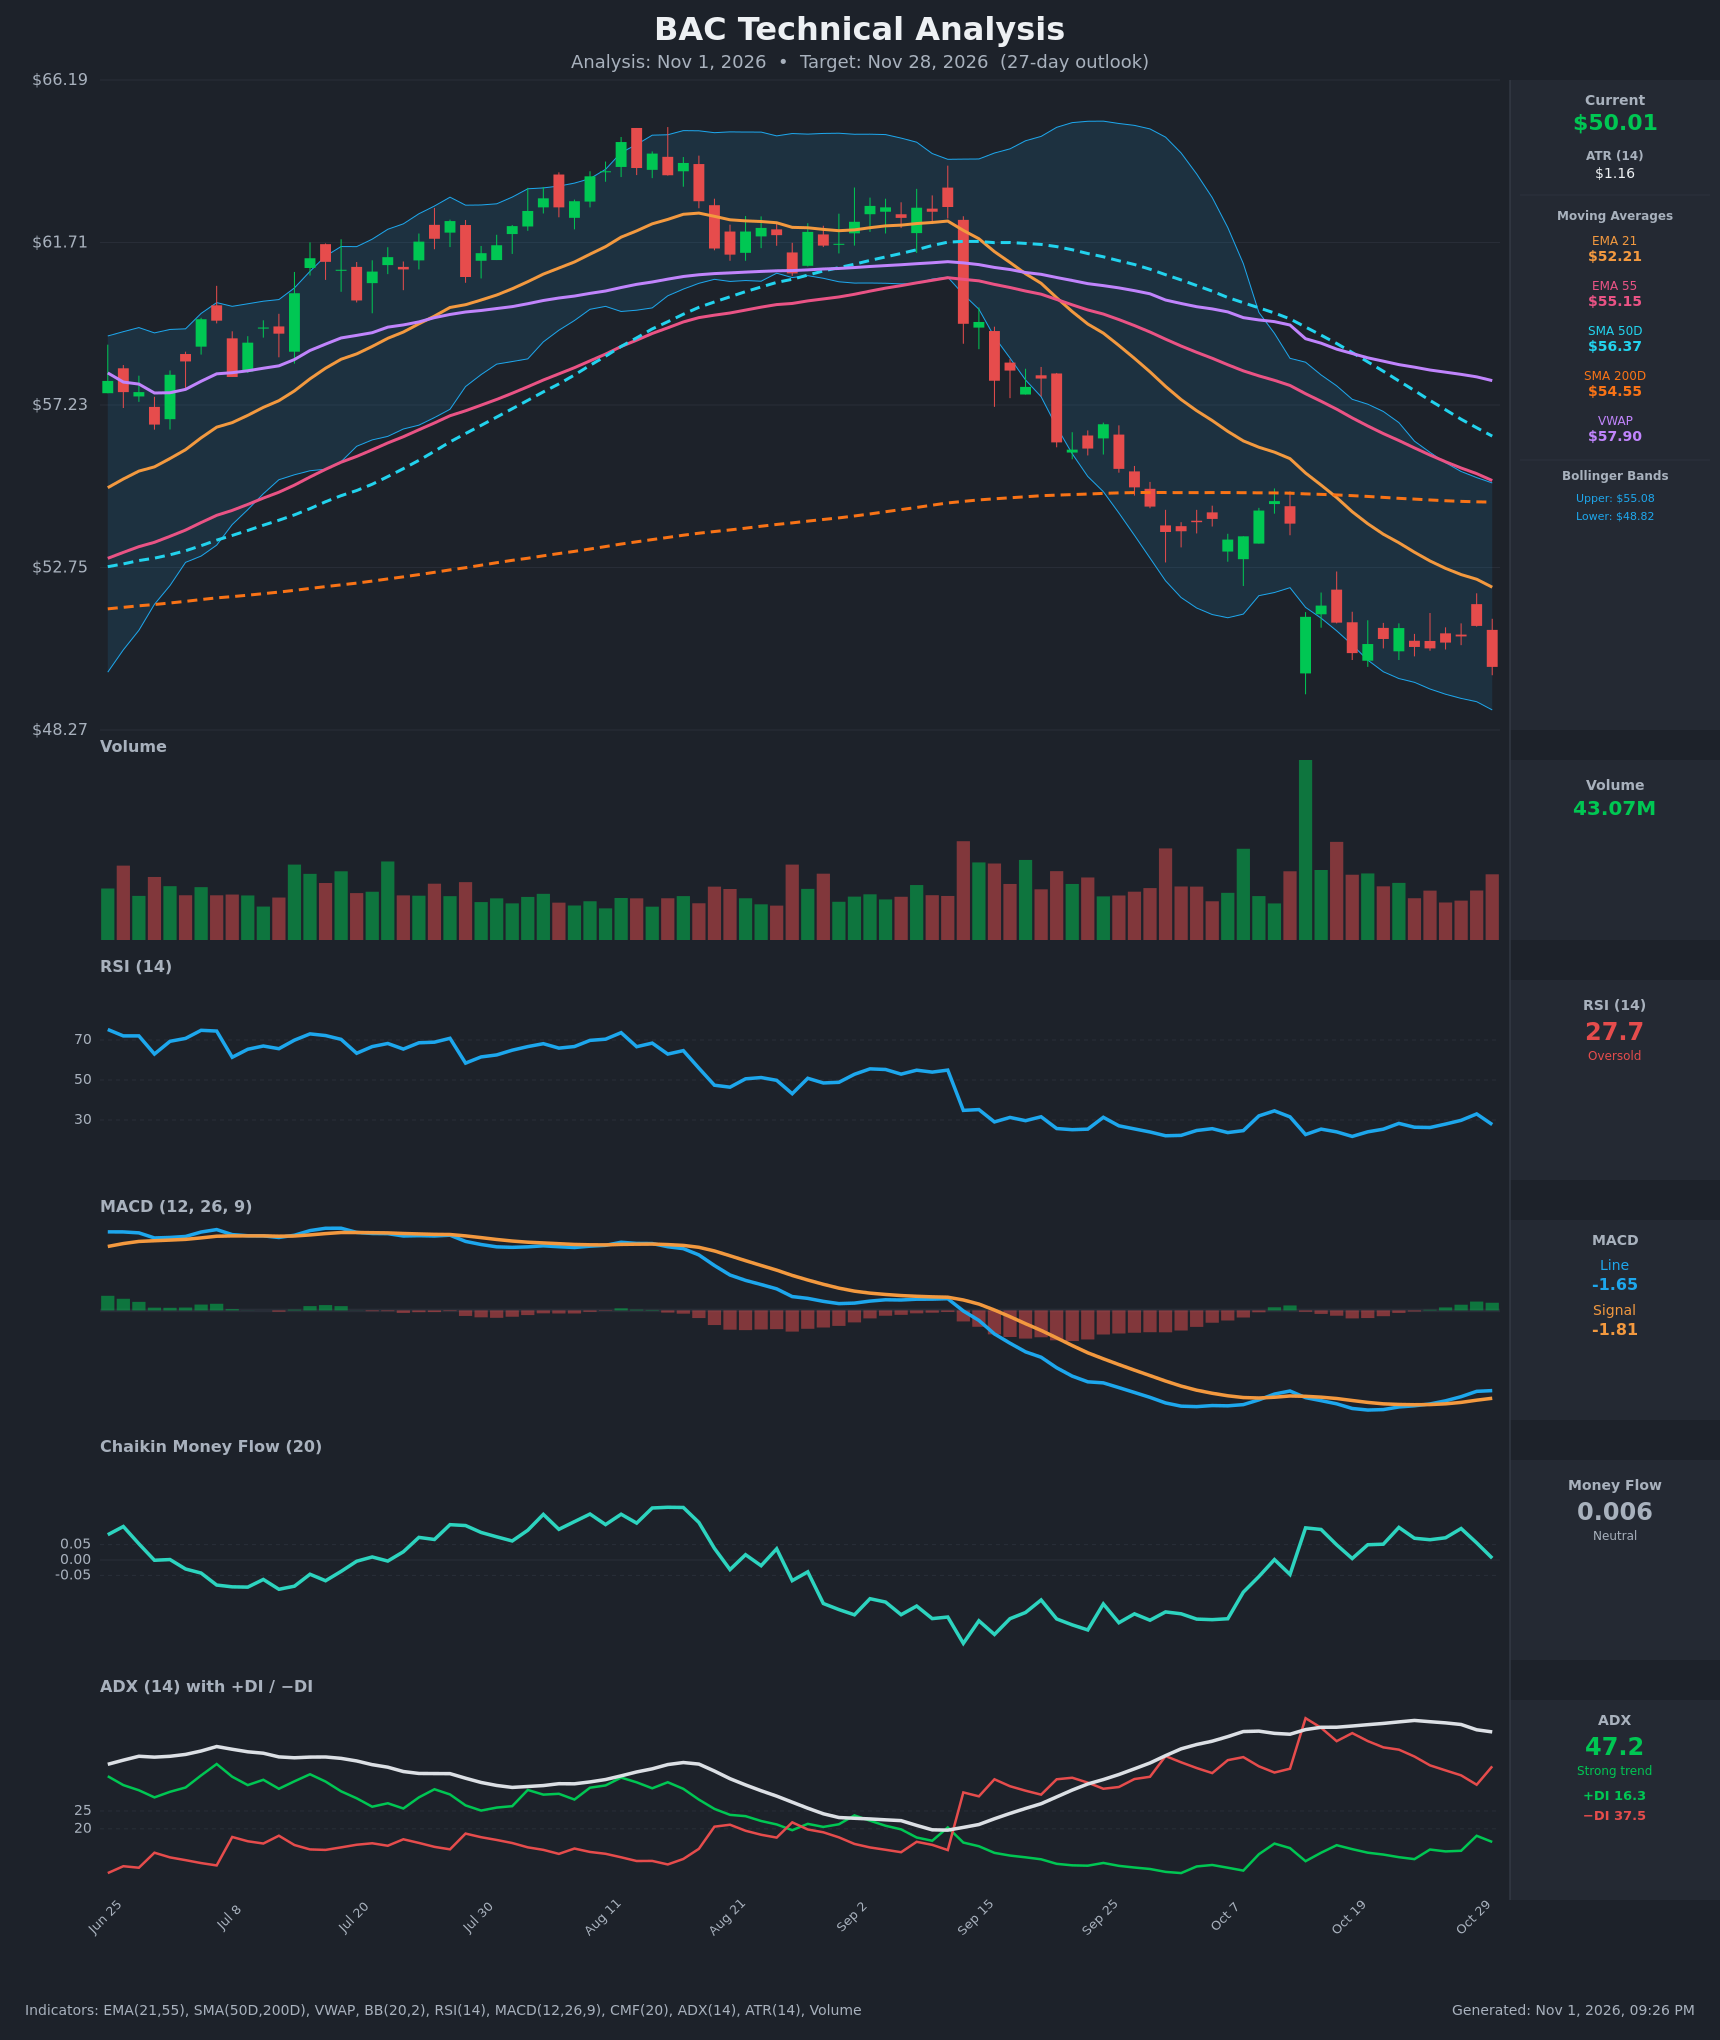
Analysis
TECHNICAL INDICATORS
- RSI (14): 27.73, oversold. It has been below 35 for about 6 weeks and made a higher low (27.7 now vs 21.8 on Oct 19) while price printed a lower low. Momentum is still weak but is no longer accelerating down. [Neutral]
- 20 EMA (EMA 21 = $52.21): Price at $50.01 is about 4% below the EMA, which is falling and acting as resistance. EMA21 is also below EMA55 ($55.15), a bearish crossover that is already well established. [Bearish]
- MACD: Line -1.649 is above signal -1.807, so the histogram is slightly positive (+0.16) and rising. The bullish crossover occurred around Oct 26-27. Both lines are deeply negative, so this is only a tentative recovery in momentum. [Bullish]
- Bollinger Bands (20): Upper $55.08, lower $48.82, mid-band about $51.95. Price is in the lower quarter of the bands, about $1.19 above the lower band. Bands are contracting after the earlier expansion, which points to a pause in volatility. A walk along the lower band is typical of a strong downtrend. [Bearish]
- CMF (20): 0.006, between ±0.05, so neutral. It has hovered around 0 to +0.10 for two weeks, showing no heavy distribution on this selloff. That is mildly constructive but not an accumulation signal. [Neutral]
- ADX (14): 47.2, a very strong trend. −DI 37.5 is well above +DI 16.3, so bears are in control. ADX has been flat to slightly lower for 3 sessions (50.4 → 47.2). Readings this high often occur near trend exhaustion. [Strong Trend – Bearish]
- Volume: 43.07M, with the latest bar a red candle on average-to-above-average volume. The large capitulation-style spike earlier in October (the biggest bar in the window) was followed by a base. The renewed red bar on decent volume shows sellers are still active. [Bearish with capitulation history]
DIVERGENCES & TRENDS
- Bullish divergence: Price made a lower low ($50.01 vs $50.39 on Oct 19), while RSI is higher (27.7 vs 21.8) and MACD is higher (-1.65 vs -2.05). This shows selling momentum fading.
- Trend structure is firmly bearish:
- Price is below EMA21, EMA55, SMA50D ($56.37), SMA200D ($54.55) and VWAP ($57.90).
- SMA50D is falling toward SMA200D, a gap of about $1.8 closing at roughly $0.25 per day. A death cross looks likely within 1-2 weeks.
- MACD: The bullish crossover is a weak, early recovery signal with both lines still far below zero.
- DI lines: −DI has stayed above +DI since mid-September. −DI has fallen from 51 to 37.5, which shows less downside pressure, but there is no bullish DI crossover.
- RSI: It has not exceeded 33 in the last 15 bars, so rallies have been shallow.
CHART PATTERNS
- Bearish Flag / Rectangle-style consolidation (continuation): After the sharp September-October drop, price consolidated sideways between about $50.4 and $51.3. The latest red candle is pushing through the bottom of that range. The measured move from a flag points lower, toward the mid-$40s. However, the range was only about 2% wide.
- Possible Bullish Double Bottom / base (reversal): Lows near $49.5-50.0 are being retested while RSI and MACD diverge. This would only be confirmed by a close above about $51.3-51.5 (the recent swing high), then $52.2 (EMA21).
- Significance: The bearish continuation pattern aligns with the trend indicators. The base and divergence align with the oscillators. A reflex bounce toward EMA21 and the mid-Bollinger band is the most likely outcome, but the downside tail is real.
POTENTIAL SCENARIOS
- Scenario 1: Bullish Oversold Relief Bounce — Bullish divergence in RSI and MACD, an oversold reading and a flat lower Bollinger Band hold support, and price mean-reverts toward the falling EMA21 and mid-band. Trigger: daily close above $51.30 with MACD histogram expanding. Target: $52.20-$53.00 (EMA21, then the top of the gap area). Invalidation: daily close below $48.80. (50% probability)
- Scenario 2: Bearish Trend Continuation / Flag Breakdown — The consolidation resolves lower with −DI dominant, a death cross imminent and persistent selling below all moving averages. Trigger: sustained close below $49.50 and below the lower BB ($48.82). Target: $46.50-$47.50 (flag measured move). Invalidation: close above $52.20. (37% probability)
- Scenario 3: Neutral Range-bound Chop — Price oscillates between about $48.80 and $52.20 as the trend exhausts and ADX rolls over. Trigger: failure to break either boundary on closing basis. Target: $50-$51. Invalidation: close outside the $48.80-$52.20 range. (13% probability)
PRICE TARGETS
- Target Price: $51.80 (27-day horizon, reflecting a partial relief bounce toward EMA21 of $52.21 rather than a full reversal)
- Expected Range: $47.60 to $54.20. Width is $6.60, which is 13.2% of the current price and fits the ~12-18% guidance for this timeframe.
- Key Levels: Support at $48.80 (lower Bollinger Band and the area of recent lows); Resistance at $52.20 (EMA21, then $54.55 SMA200D and $55.15 EMA55 above)
OVERALL BIAS
OVERALL BIAS: BULLISH - A modest relief rally is favored: RSI is oversold (27.7) with a bullish divergence, MACD has crossed above its signal line, and price sits near the lower Bollinger Band. The trend is still firmly bearish (ADX 47, −DI dominant, price below every moving average), so the upside is likely limited to the EMA21 area near $52. A close below $48.80 would invalidate the bounce thesis.
This is educational analysis and not financial advice.