QQQ 27-day bearish forecast — Nov 1, 2026
- Bias: Bearish
- Timeframe: 27 days (made Nov 1, 2026, target date Nov 27, 2026)
- Price at analysis: $690.49
- Price target: $678.00
- Expected range: $632.00 – $725.00
- Result: Pending — graded after the close on Nov 27, 2026
Get a free AI analysis of QQQ today
Analysis
TECHNICAL INDICATORS
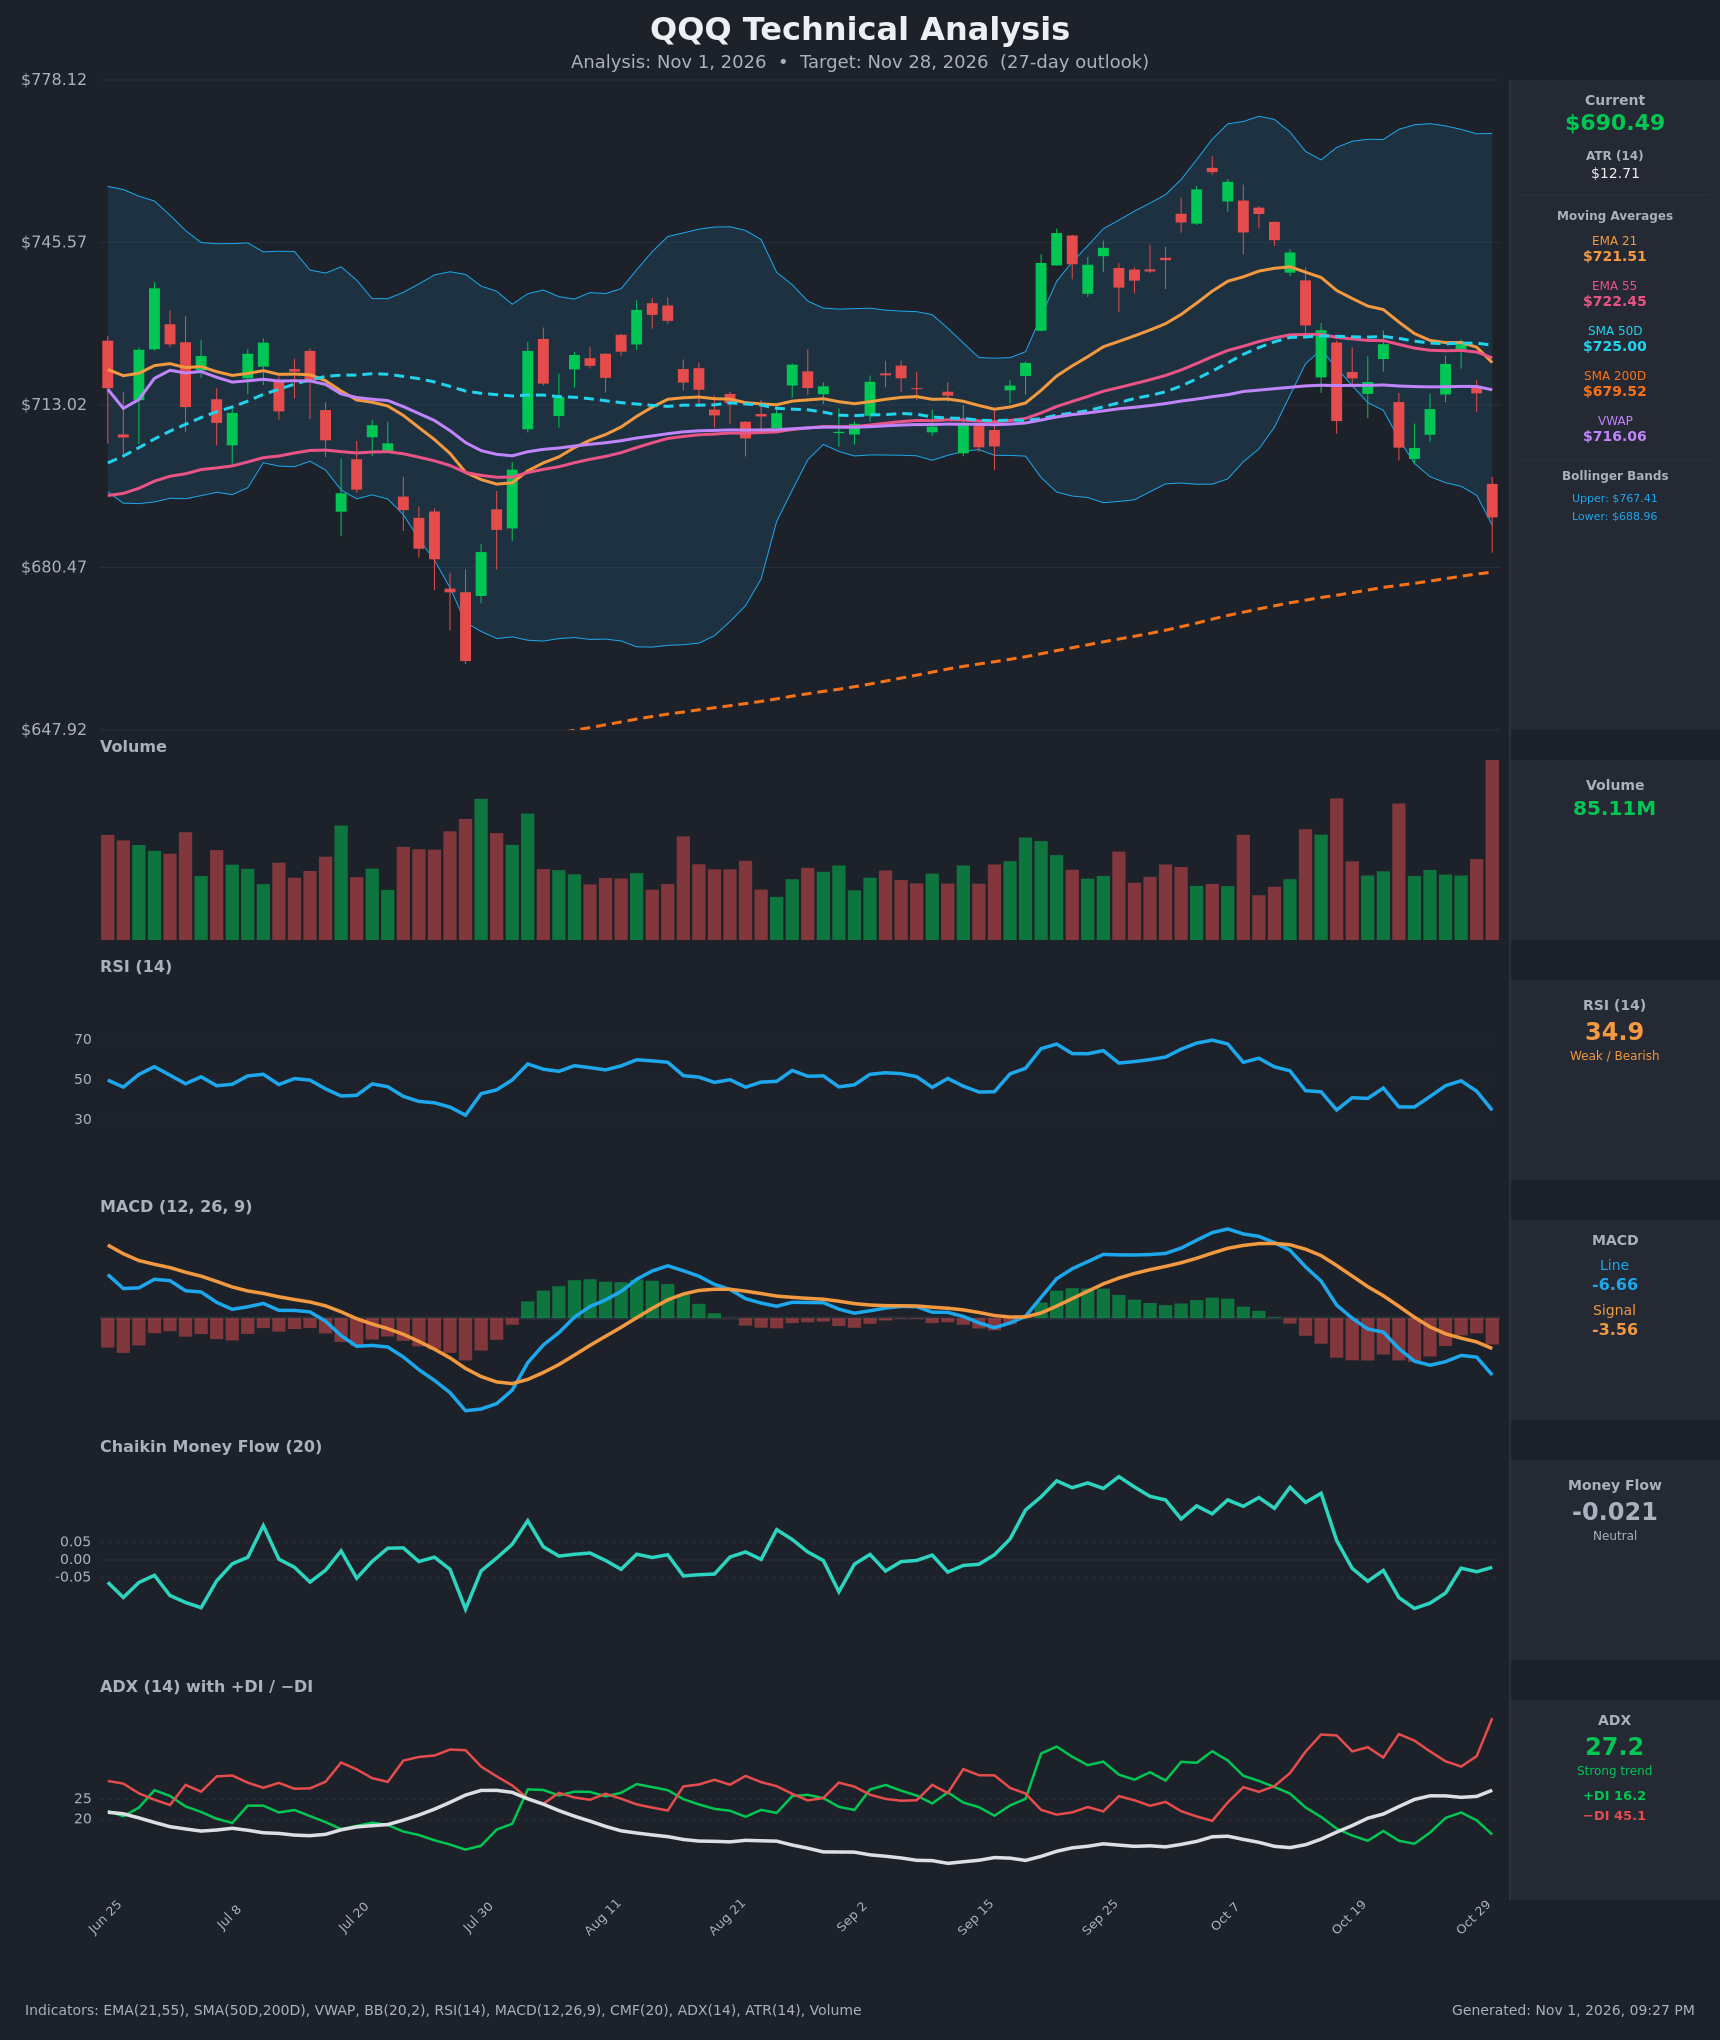
- RSI (14): 34.88, down from 49.6 on Oct 28 and approaching the 30 oversold line but not yet there. Momentum is falling after a failed bounce, and RSI is making lower highs. [Bearish]
- 20 EMA: The 21 EMA is $721.51 and price at $690.49 is about 4.3% below it, so it acts as overhead resistance. The EMA21 has also fallen just below the EMA55 ($722.45), a fresh bearish crossover. [Bearish]
- MACD: Line -6.66 is below signal -3.56 and the histogram is widening negative. The bearish cross happened around Oct 19-23 and the gap is still growing. [Bearish]
- Bollinger Bands (20): Price at $690.49 is hugging the lower band ($688.96), with the upper band at $767.41. The wide bands show elevated volatility. A band walk is possible in a strong downtrend, though a close at or below the lower band can also set up a short-term mean-reversion bounce. [Bearish]
- CMF (20): -0.021 sits in the neutral zone (±0.05). It has rolled over from +0.20 earlier in October, so buying pressure has faded without clear distribution yet. [Neutral]
- ADX (14): 27.2 and rising, with −DI (45.1) far above +DI (16.2). This is a strong, established downtrend with bears firmly in control. [Strong Trend – Bearish]
- Volume: 85.11M on the final bar is the highest in the visible window and came on a heavy red candle (-3.5%). That signals real selling or distribution, though it could also mark a capitulation-style flush. [Bearish – high-volume breakdown]
DIVERGENCES & TRENDS
- No bullish RSI or MACD divergence is visible. RSI (34.9) and MACD are making new lows in line with price, so momentum confirms the decline.
- Price has dropped from the ~$766 peak in early October to $690, a ~10% decline. It broke below the EMA21, EMA55, SMA50D ($725.00) and VWAP ($716.06), and all are now overhead and clustered at $716-$725.
- The EMA21/EMA55 bearish cross has just occurred. SMA50D ($725.00) remains above SMA200D ($679.52), so there is no death cross, but the 50D is rolling over.
- The only major support nearby is the rising SMA200D at ~$679.5, about 1.6% below. The July low near $660 is the next major floor.
- The DI spread (−DI at 45 vs +DI at 16) is very wide, which often precedes a short-term oversold bounce even within a downtrend.
- Price is also at the lower Bollinger Band on peak volume, which is a classic exhaustion-or-continuation decision point.
CHART PATTERNS
- Price formed a rounded top / lower-high structure from the early-October peak, with a sharp breakdown from the consolidation near $725. This loosely resembles a Bearish Head and Shoulders / Double Top reversal, where the neckline break projects continued downside.
- The sideways range around $710-$745 in Aug-Sep acted as a base. Its breakdown on a high-volume bar implies a measured move toward the SMA200D area ($679) and possibly the July low ($660).
- A Bearish Flag (the Oct 19-28 rebound to ~$725) already failed at the EMA cluster, which supports continuation lower.
- The measured move from the ~$725 breakdown with a ~$40 pattern height projects to ~$680-$685.
- No bullish reversal pattern (double bottom or falling wedge) has formed yet.
POTENTIAL SCENARIOS
- Scenario 1: Bearish Trend Continuation to the 200D — Strong ADX and −DI dominance, a MACD bearish cross, and a rejection from the EMA cluster point to a test of the SMA200D and possibly a dip toward the July lows. Trigger: daily close below $688 (lower BB) and then below the SMA200D (~$680). Target: $665-$680. Invalidation: daily close above $722 (EMA21/55). (45% probability)
- Scenario 2: Bullish Oversold Bounce and Range — A bounce off the 200D support and lower Bollinger Band, with RSI near 30 and a stretched DI spread, lifts price back toward the broken EMA/VWAP resistance cluster. Trigger: a hold above $679 and reclaim of $700. Target: $712-$722. Invalidation: close below $675. (35% probability)
- Scenario 3: Bearish Capitulation Breakdown — A break below the 200D leads to an accelerated selloff toward the July low. Trigger: close below $675 on heavy volume. Target: $650-$660. Invalidation: reclaim of $690 on strong volume. (20% probability)
PRICE TARGETS
For a 27-day horizon, the range should be about 12-18% of price (~$83-$124). The chosen range is $632.00 to $725.00 (width $93, about 13.5%).
- Target Price: $678.00 (27 days)
- Expected Range: $632.00 to $725.00
- Key Levels: Support at $679.52 (SMA200D), Resistance at $716.06 (VWAP; EMA21/55 cluster at $721-$725)
OVERALL BIAS
OVERALL BIAS: BEARISH - Price has broken below all its short-term moving averages and VWAP. MACD is bearish and widening, and ADX of 27 with −DI at 45 confirms a strong downtrend, backed by a high-volume down bar. Oversold-bounce risk near the 200D SMA ($679.5) limits conviction, but the evidence still favors a lower price in 27 days.
This is educational analysis and not financial advice.