QCOM 27-day bearish forecast — Nov 1, 2026
- Bias: Bearish
- Timeframe: 27 days (made Nov 1, 2026, target date Nov 27, 2026)
- Price at analysis: $164.79
- Price target: $159.50
- Expected range: $148.50 – $173.50
- Result: Pending — graded after the close on Nov 27, 2026
Get a free AI analysis of QCOM today
Analysis
TECHNICAL INDICATORS
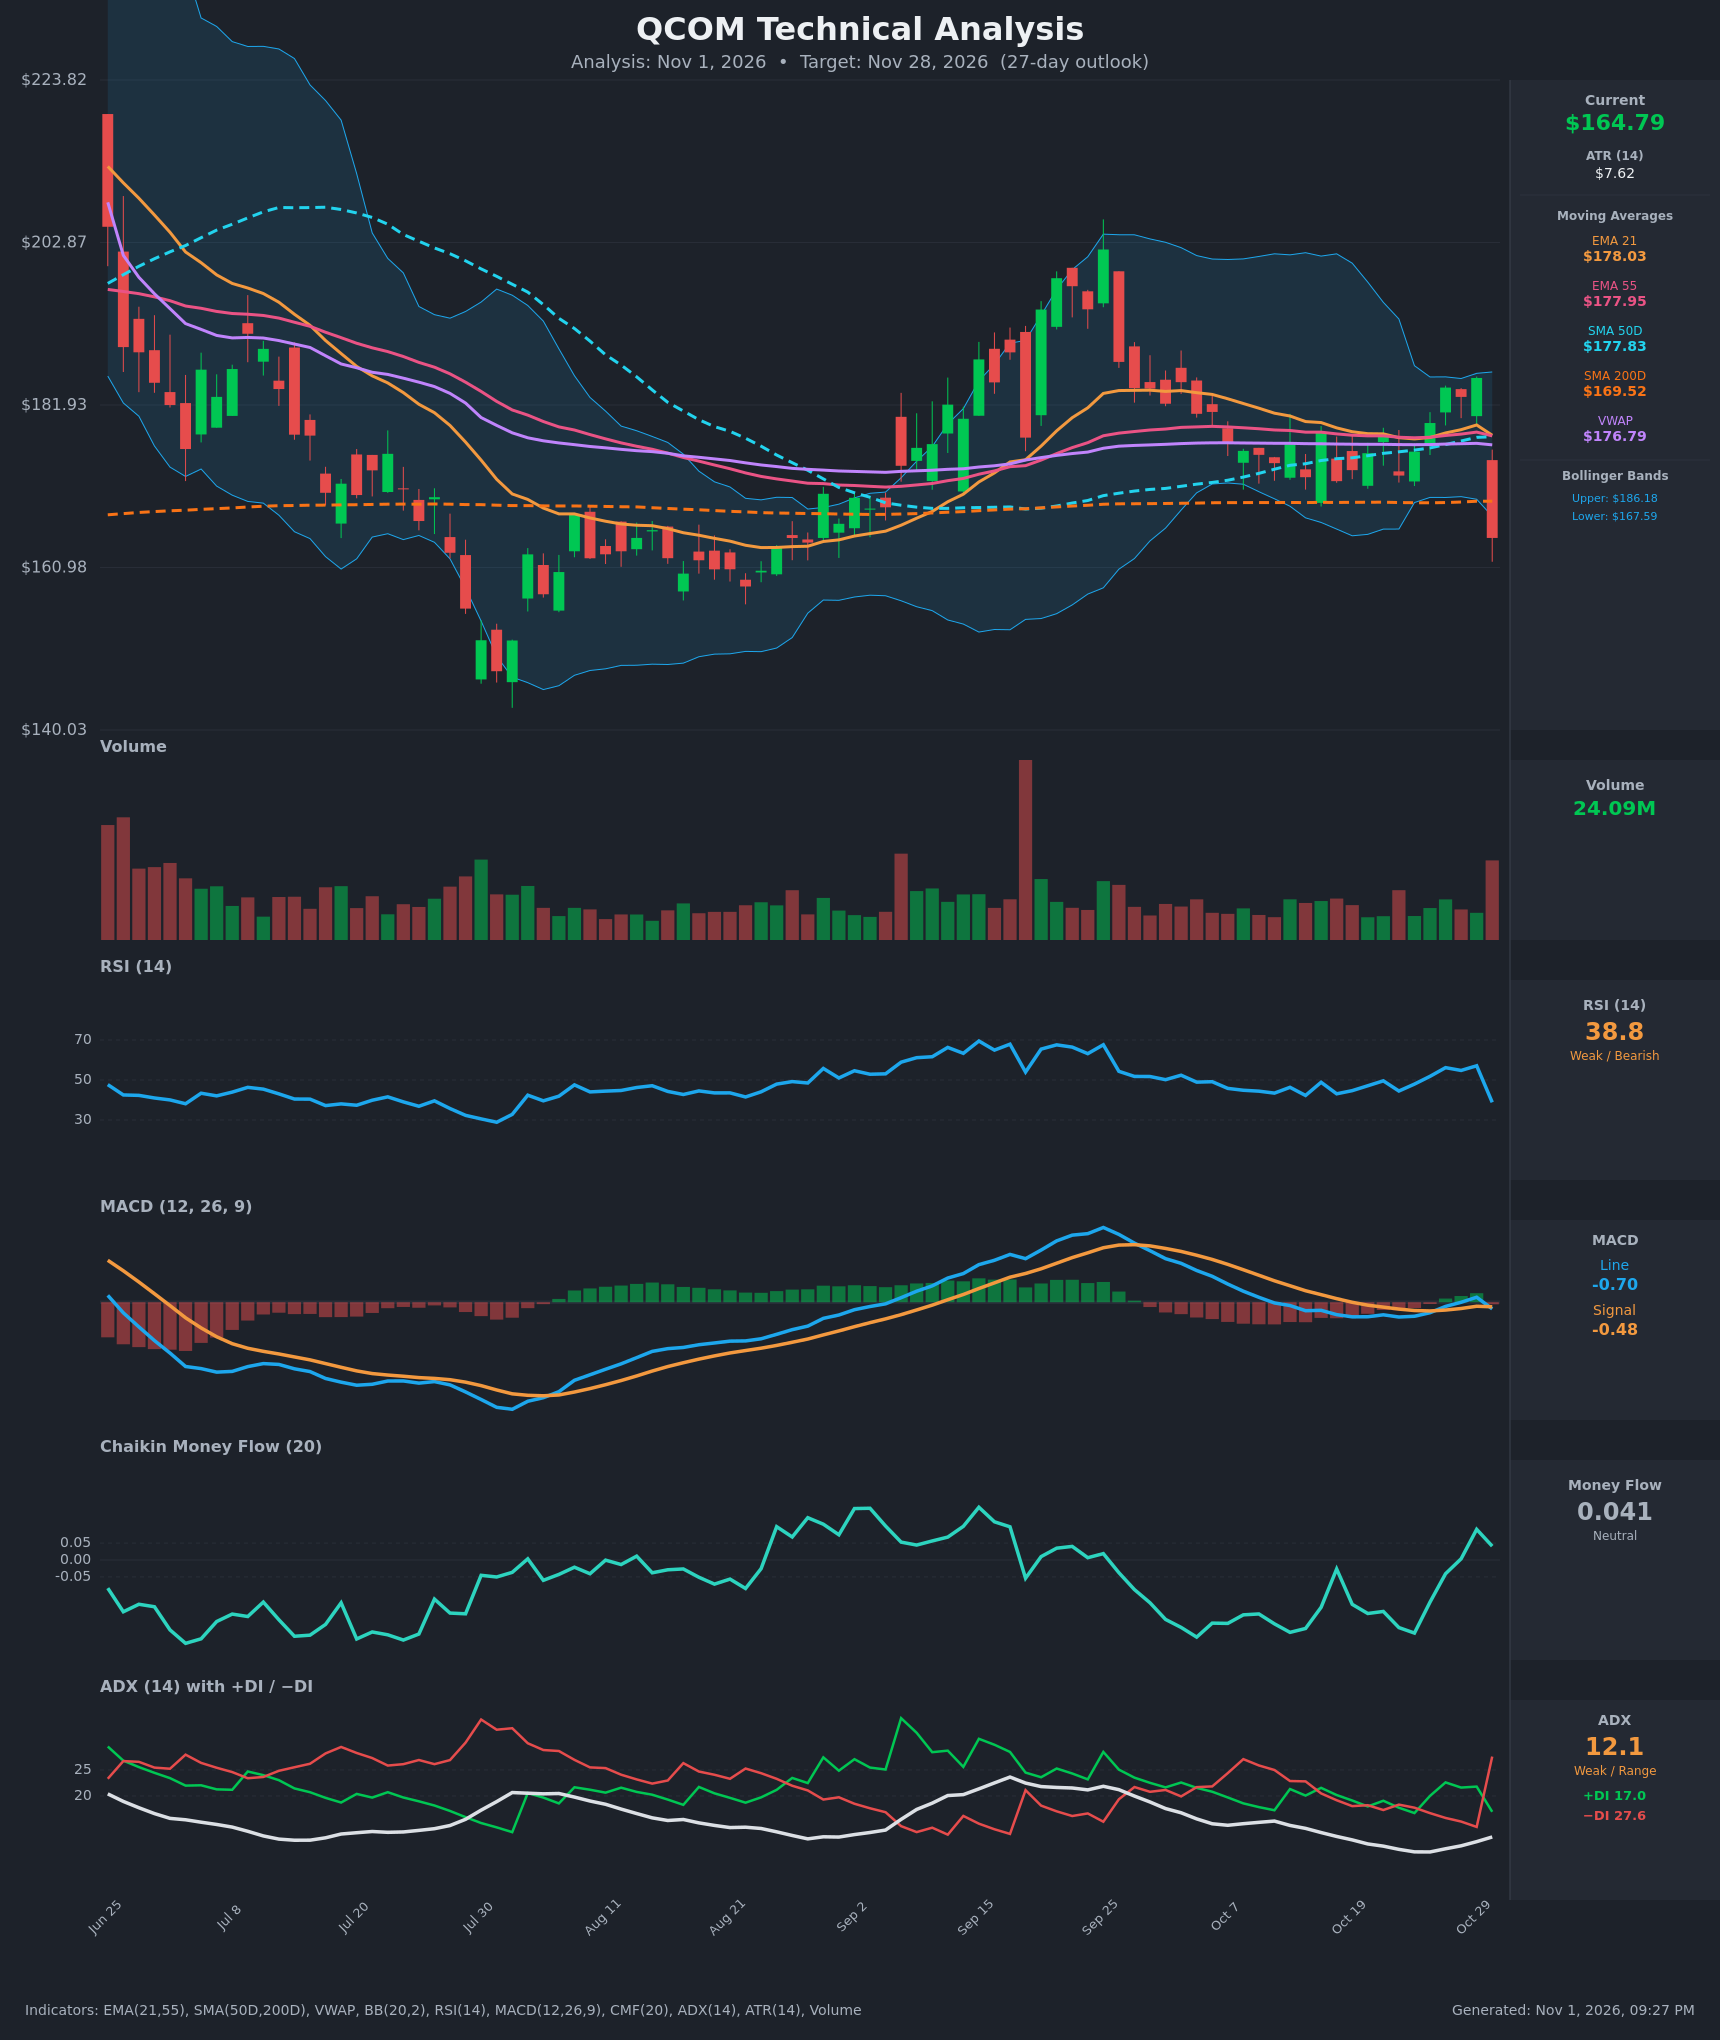
- RSI (14): 38.84, down sharply from 57.1 on Oct 29 after an ~11% one-day drop. It is below the 50 midline but not oversold (<30), so there is room for further downside before a classic oversold reading. [Bearish]
- 20 EMA: The EMA 21 is $178.03 and price at $164.79 is about 7.4% below it, so it acts as overhead resistance. EMA 21 ($178.03) is barely above EMA 55 ($177.95), so the two are flat and converging. [Bearish]
- MACD: The line (-0.70) crossed back below the signal (-0.48) on the last bar, after a brief positive reading (+0.53) the day before. The histogram has flipped negative. The crossover is fresh and momentum is rolling over. [Bearish]
- Bollinger Bands (20): Price at $164.79 closed below the lower band ($167.59), with the upper band at $186.18. After weeks of squeeze, the bands are now expanding on a downside breakout. A close outside the band after a gap often means continuation, though it also raises the chance of a short-term bounce. [Bearish]
- CMF (20): 0.041 is inside the neutral zone (±0.05). It had been rising from -0.2 to +0.09, so recent accumulation is fading and the reading will probably fall as the heavy-volume down day rolls in. [Neutral]
- ADX (14): 12.1 is weak and range-bound, but −DI (27.6) has jumped above +DI (17.0) from a prior +DI lead. That is a sharp bearish DI crossover. The trend is not established yet, but control has shifted to sellers. [Weak Trend, bearish direction]
- Volume: 24.09M on the Oct 30 bar is the heaviest red bar since the Sep 18 spike. Heavy volume on a large down candle suggests institutional distribution or a news-driven repricing. [Bearish]
DIVERGENCES & TRENDS
- No classic divergence. RSI and MACD confirm the price drop, with RSI falling from 57 to 39 in one bar.
- Moving averages: Price is now below the SMA200D ($169.52), which had supported the whole October range, as well as the EMA 21/55, SMA50D ($177.83) and VWAP ($176.79). SMA50D remains above SMA200D, so no death cross has occurred, but the gap is narrowing.
- Trend in October: Price coiled around $172–$185 with ADX falling to 9–10 and the MAs converging at ~$178. The Oct 30 gap-down is a decisive break of this equilibrium to the downside.
- Crossovers: The bearish MACD recross and the −DI/+DI flip both occurred on the last bar.
- CMF's rise to +0.09 during the pre-drop rally did not protect price, which is a warning that the accumulation was shallow.
CHART PATTERNS
- Consolidation breakdown: The October range ($172–$185) with converging MAs resembles a Symmetrical Triangle or range. The downside break on heavy volume points toward the bearish resolution. The measured move from range height (~$13) projects to roughly $159–$160 from the $172 floor.
- Bearish Double Top (loose): Peaks near $198–$203 in mid and late September, followed by the slide below the neckline in the $172–$175 zone, are consistent with a double-top reversal. The target from that pattern lies near $145–$150, in line with the July low.
- Gap-down risk: The gap leaves the $165–$172 area as overhead supply. Failure to reclaim the SMA200D quickly would support continuation.
POTENTIAL SCENARIOS
- Scenario 1: Bearish Post-Breakdown Continuation — Sellers hold control after the heavy-volume gap below the SMA200D, and price drifts lower toward the August lows. Trigger: failure to reclaim $169.52 and a close below $161. Target: $159.50 initially, with an extension to $150–$155. Invalidation: a daily close above $172 (back inside the range). (50% probability)
- Scenario 2: Neutral Stabilization Range — The selloff gets absorbed and price consolidates below the SMA200D between support and the gap. Trigger: low-volume basing candles around $160–$165. Target: $160–$169. Invalidation: close below $155 or above $172. (25% probability)
- Scenario 3: Bullish Oversold Rebound — Price closed below the lower Bollinger Band, and buyers push it back above the SMA200D, filling part of the gap. Trigger: a close above $169.52 on rising volume. Target: $175–$178 (VWAP/EMA cluster). Invalidation: a close back below $162. (25% probability)
PRICE TARGETS
- Target Price: $159.50 (27-day)
- Expected Range: $148.50 to $173.50 (width $25.00, about 15.2% of current price, within the 12–18% guide for 30–60 days, scaled for 27 days)
- Key Levels: Support at $155.00, Resistance at $169.52
OVERALL BIAS
OVERALL BIAS: BEARISH - Price gapped ~11% lower on heavy volume, breaking below the SMA200D, the EMAs and the lower Bollinger Band, while the MACD recrossed bearish and −DI jumped well above +DI. The low ADX and a possible bounce from the lower band temper conviction, but the evidence favors a drift toward the $155–$160 area.
This is educational analysis and not financial advice.