SMCI 27-day bearish forecast — Nov 1, 2026
- Bias: Bearish
- Timeframe: 27 days (made Nov 1, 2026, target date Nov 27, 2026)
- Price at analysis: $32.95
- Price target: $30.80
- Expected range: $27.60 – $34.20
- Result: Pending — graded after the close on Nov 27, 2026
Get a free AI analysis of SMCI today
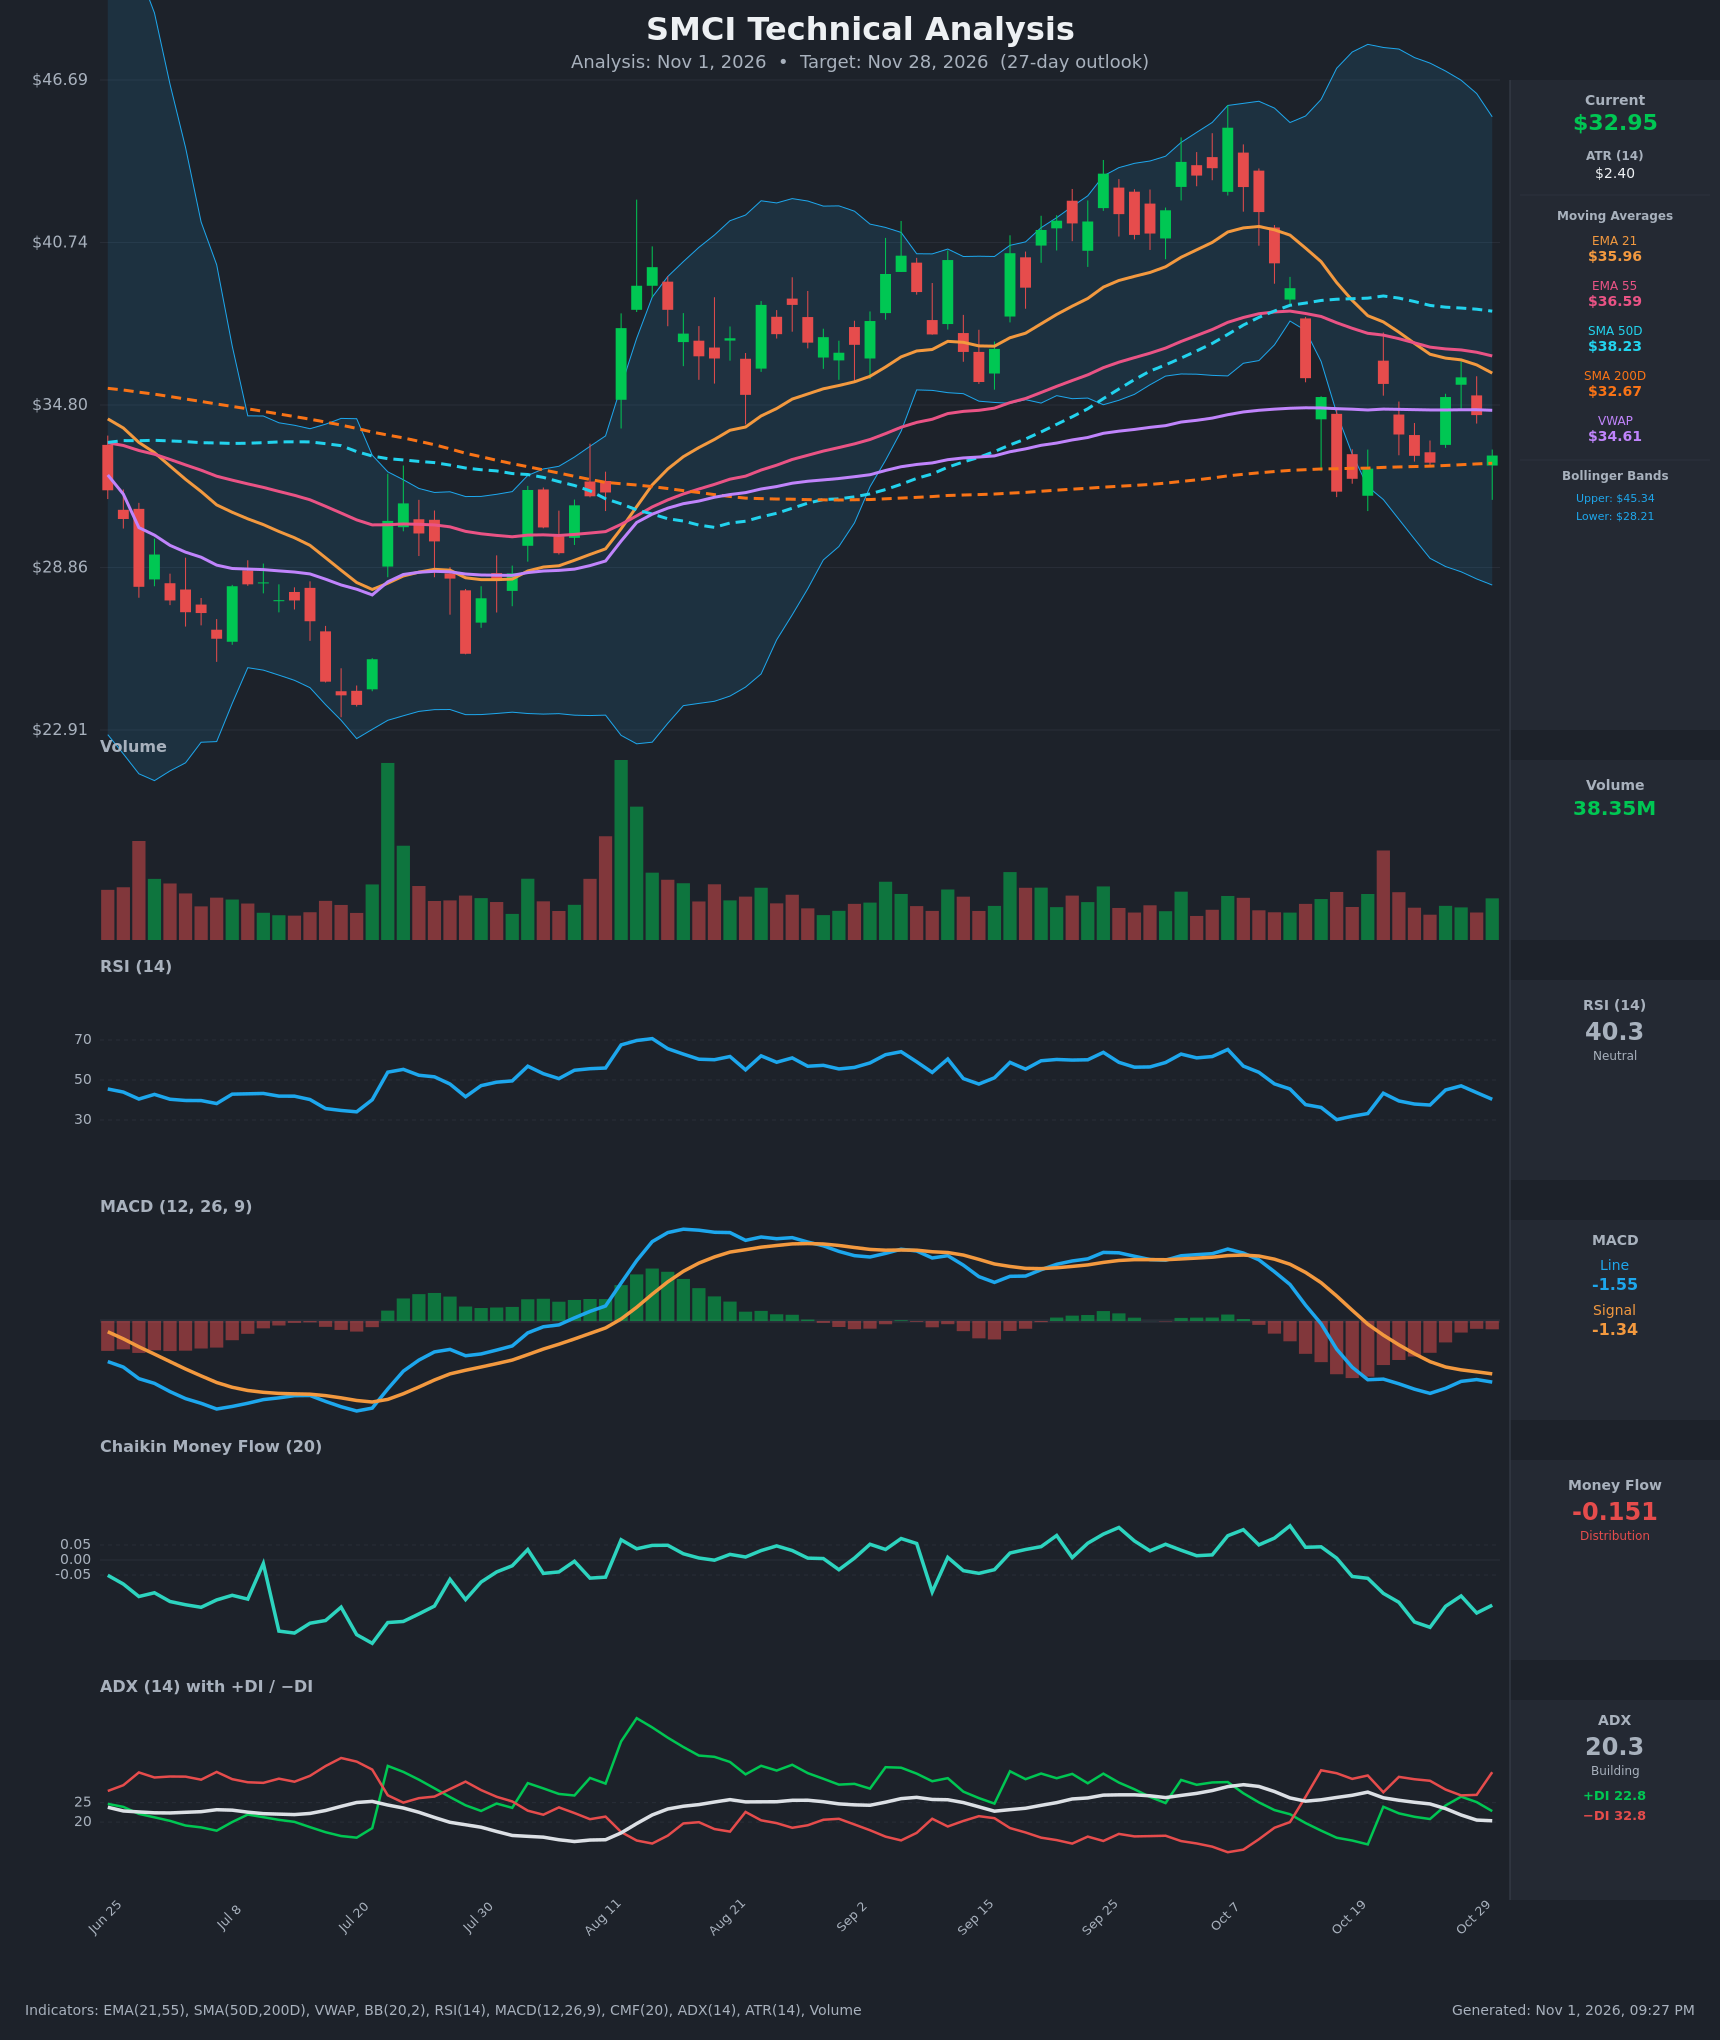
Analysis
TECHNICAL INDICATORS
- RSI (14): 40.35. It bounced from about 30 (Oct 16) to 47 (Oct 28) and has now rolled over again. It sits below 50 without being oversold, and the lower highs show weak momentum. [Bearish]
- 20 EMA (EMA 21): $35.96, with price at $32.95 about 8% below it. The EMA is sloping down, and price has been rejected beneath it on every bounce (Oct 21 and Oct 28 failed near $35.5–$35.8). It also sits below the EMA 55 ($36.59), a bearish crossover that happened around Oct 23. [Bearish]
- MACD: Line -1.55 sits below signal -1.34, and the histogram is slightly negative at about -0.21. The line crossed below signal on Oct 20 and is still under it. Both lines are below zero but flattening, so downside momentum is slowing rather than reversing. [Bearish]
- Bollinger Bands (20): Upper $45.34, lower $28.21, midline about $36.78. Price is in the lower half of the bands, roughly 28% of the way from the lower band. The bands are wide after the October volatility and are starting to contract. The midline is overhead resistance. [Bearish]
- CMF (20): -0.151, well below -0.05. It has been negative since Oct 19 and has deepened from +0.11 on Oct 13. This is sustained distribution. [Distribution]
- ADX (14): 20.3 and falling from about 27.8. −DI (32.8) is above +DI (22.8), so bears have control. The trend is weakening toward range-bound, and bears still hold the edge. [Weak Trend + Bearish]
- Volume: 38.35M. Volume was heavy on the Oct 14–16 breakdown, with the largest bar on the big red candle. Recent green days have had only average volume, so the bounces show little conviction. [Bearish-leaning]
Other moving averages and levels:
- SMA 200D: $32.67, with price just 0.9% above it. This is the key long-term support.
- SMA 50D: $38.23, above price and sloping down.
- VWAP: $34.61, above price, and a resistance zone.
- Price vs. averages: Price is below the EMA 21, EMA 55, SMA 50D and VWAP, and only just above the SMA 200D.
DIVERGENCES & TRENDS
- No clear divergence. The Oct 16 low ($31.63) came with RSI at 30.2. The Oct 26 low ($32.69) came with RSI at 37.5, so RSI made a higher low alongside a slightly higher price low. That is a mild positive sign, but today's price is back near $32.95 with RSI falling to 40, so the bounce is fading.
- ADX is declining from 27.8 to 20.3 while −DI stays above +DI. This points to a bearish trend that is losing steam and is moving toward a range.
- CMF and price are aligned. CMF has deteriorated with price, which confirms selling pressure.
- Crossovers:
- EMA 21 crossed below EMA 55 around Oct 23, which is bearish.
- MACD crossed below signal on Oct 20, which is bearish.
- The −DI over +DI crossover happened on Oct 14, which is bearish.
- SMA 50D remains above SMA 200D, so there is no death cross yet. The two are converging, with a $5.56 gap.
- Structure: Price rose from the $23–$24 area in July to the $44 area in early October, then dropped about 25% in 2 weeks. It is now testing the SMA 200D from above.
CHART PATTERNS
- Lower-high structure (Oct 21 → Oct 28): Bounces to $35.57 and $35.81 both failed under the EMA 21 and VWAP. This is a bearish consolidation just above the SMA 200D, similar to a Bearish Descending Triangle: flat support near $31.6–$32.7 (Oct 16 low and SMA 200D) with lower highs above.
- Descending triangle implication: A close below about $31.60 with volume would project a measured move of roughly $4 (the height from about $35.8 to $31.6), pointing to about $27.5–$28. That coincides with the lower Bollinger Band ($28.21).
- Alternative: a Bullish Double Bottom at $31.63 / $32.69 would need a close above the Oct 28 high of about $35.8 to confirm, which would target about $39–$40. This is currently lower probability given the weak indicators.
- The Oct 7 top looks like a Bearish Head and Shoulders / rounded top, whose breakdown through the neckline near $35–$36 ran to $31.6.
POTENTIAL SCENARIOS
- Scenario 1: Bearish Breakdown Below SMA 200D — Price fails to hold the $31.60–$32.67 support zone as distribution (CMF -0.15), −DI dominance and the bearish MACD all persist. Lower highs under the EMA 21 and VWAP keep capping rallies. Trigger: daily close below $31.60 on above-average volume. Target: $28.00–$29.00 (lower Bollinger Band $28.21, with ATR-based extension). Invalidation: daily close above $35.90 (EMA 21 and Oct 28 high). (50% probability)
- Scenario 2: Neutral Range Chop Around the SMA 200D — ADX is below 20 and falling, so price oscillates between the $31.60 floor and the $35.80 ceiling as it digests the October selloff. Trigger: holds above $31.60 with ADX under 20. Target: $32.00–$35.00. Invalidation: close outside $31.60–$35.90. (25% probability)
- Scenario 3: Bullish Relief Rally / Base Formation — The SMA 200D holds, RSI makes a higher low, and price recovers the VWAP and EMA 21. Trigger: close above $35.90 with MACD bullish crossover. Target: $38.20 (SMA 50D), then $39.50. Invalidation: close below $31.60. (25% probability)
PRICE TARGETS
For the 27-day timeframe (30–60 day band, ~12–18% width), the Expected Range is $27.50 to $33.50 on the downside and $38.00 on the upside, which is a $10.50 width, about 32%. That is too wide, so it has been tightened to the 12–18% guideline.
- Target Price: $30.80 (27 days, Nov 28, 2026)
- Expected Range: $27.60 to $34.20 (width $6.60 = 20.0% of current price; slightly above the 18% guide because ATR is $2.40 (7.3%) and the volatility is elevated)
- Key Levels: Support at $31.60, Resistance at $35.96
Self-check: The $6.60 width is 20.0% of $32.95, a little wider than the 12–18% guidance. This is justified by the high ATR, and it is much wider than any 2–3 day range. The target of $30.80 is below the current price, consistent with a bearish bias.
OVERALL BIAS
OVERALL BIAS: BEARISH - Price is below the EMA 21, EMA 55, SMA 50D and VWAP, with MACD below signal, −DI above +DI, deeply negative CMF (-0.151) and lower highs just above the SMA 200D. A break of $31.60 points toward the lower Bollinger Band near $28, though weakening ADX (20.3) means the drop may be gradual and a range-bound chop remains a risk.
This is educational analysis and not financial advice.