TLT 27-day bullish forecast — Nov 1, 2026
- Bias: Bullish
- Timeframe: 27 days (made Nov 1, 2026, target date Nov 27, 2026)
- Price at analysis: $81.84
- Price target: $83.10
- Expected range: $77.40 – $86.40
- Result: Pending — graded after the close on Nov 27, 2026
Get a free AI analysis of TLT today
Analysis
TECHNICAL INDICATORS
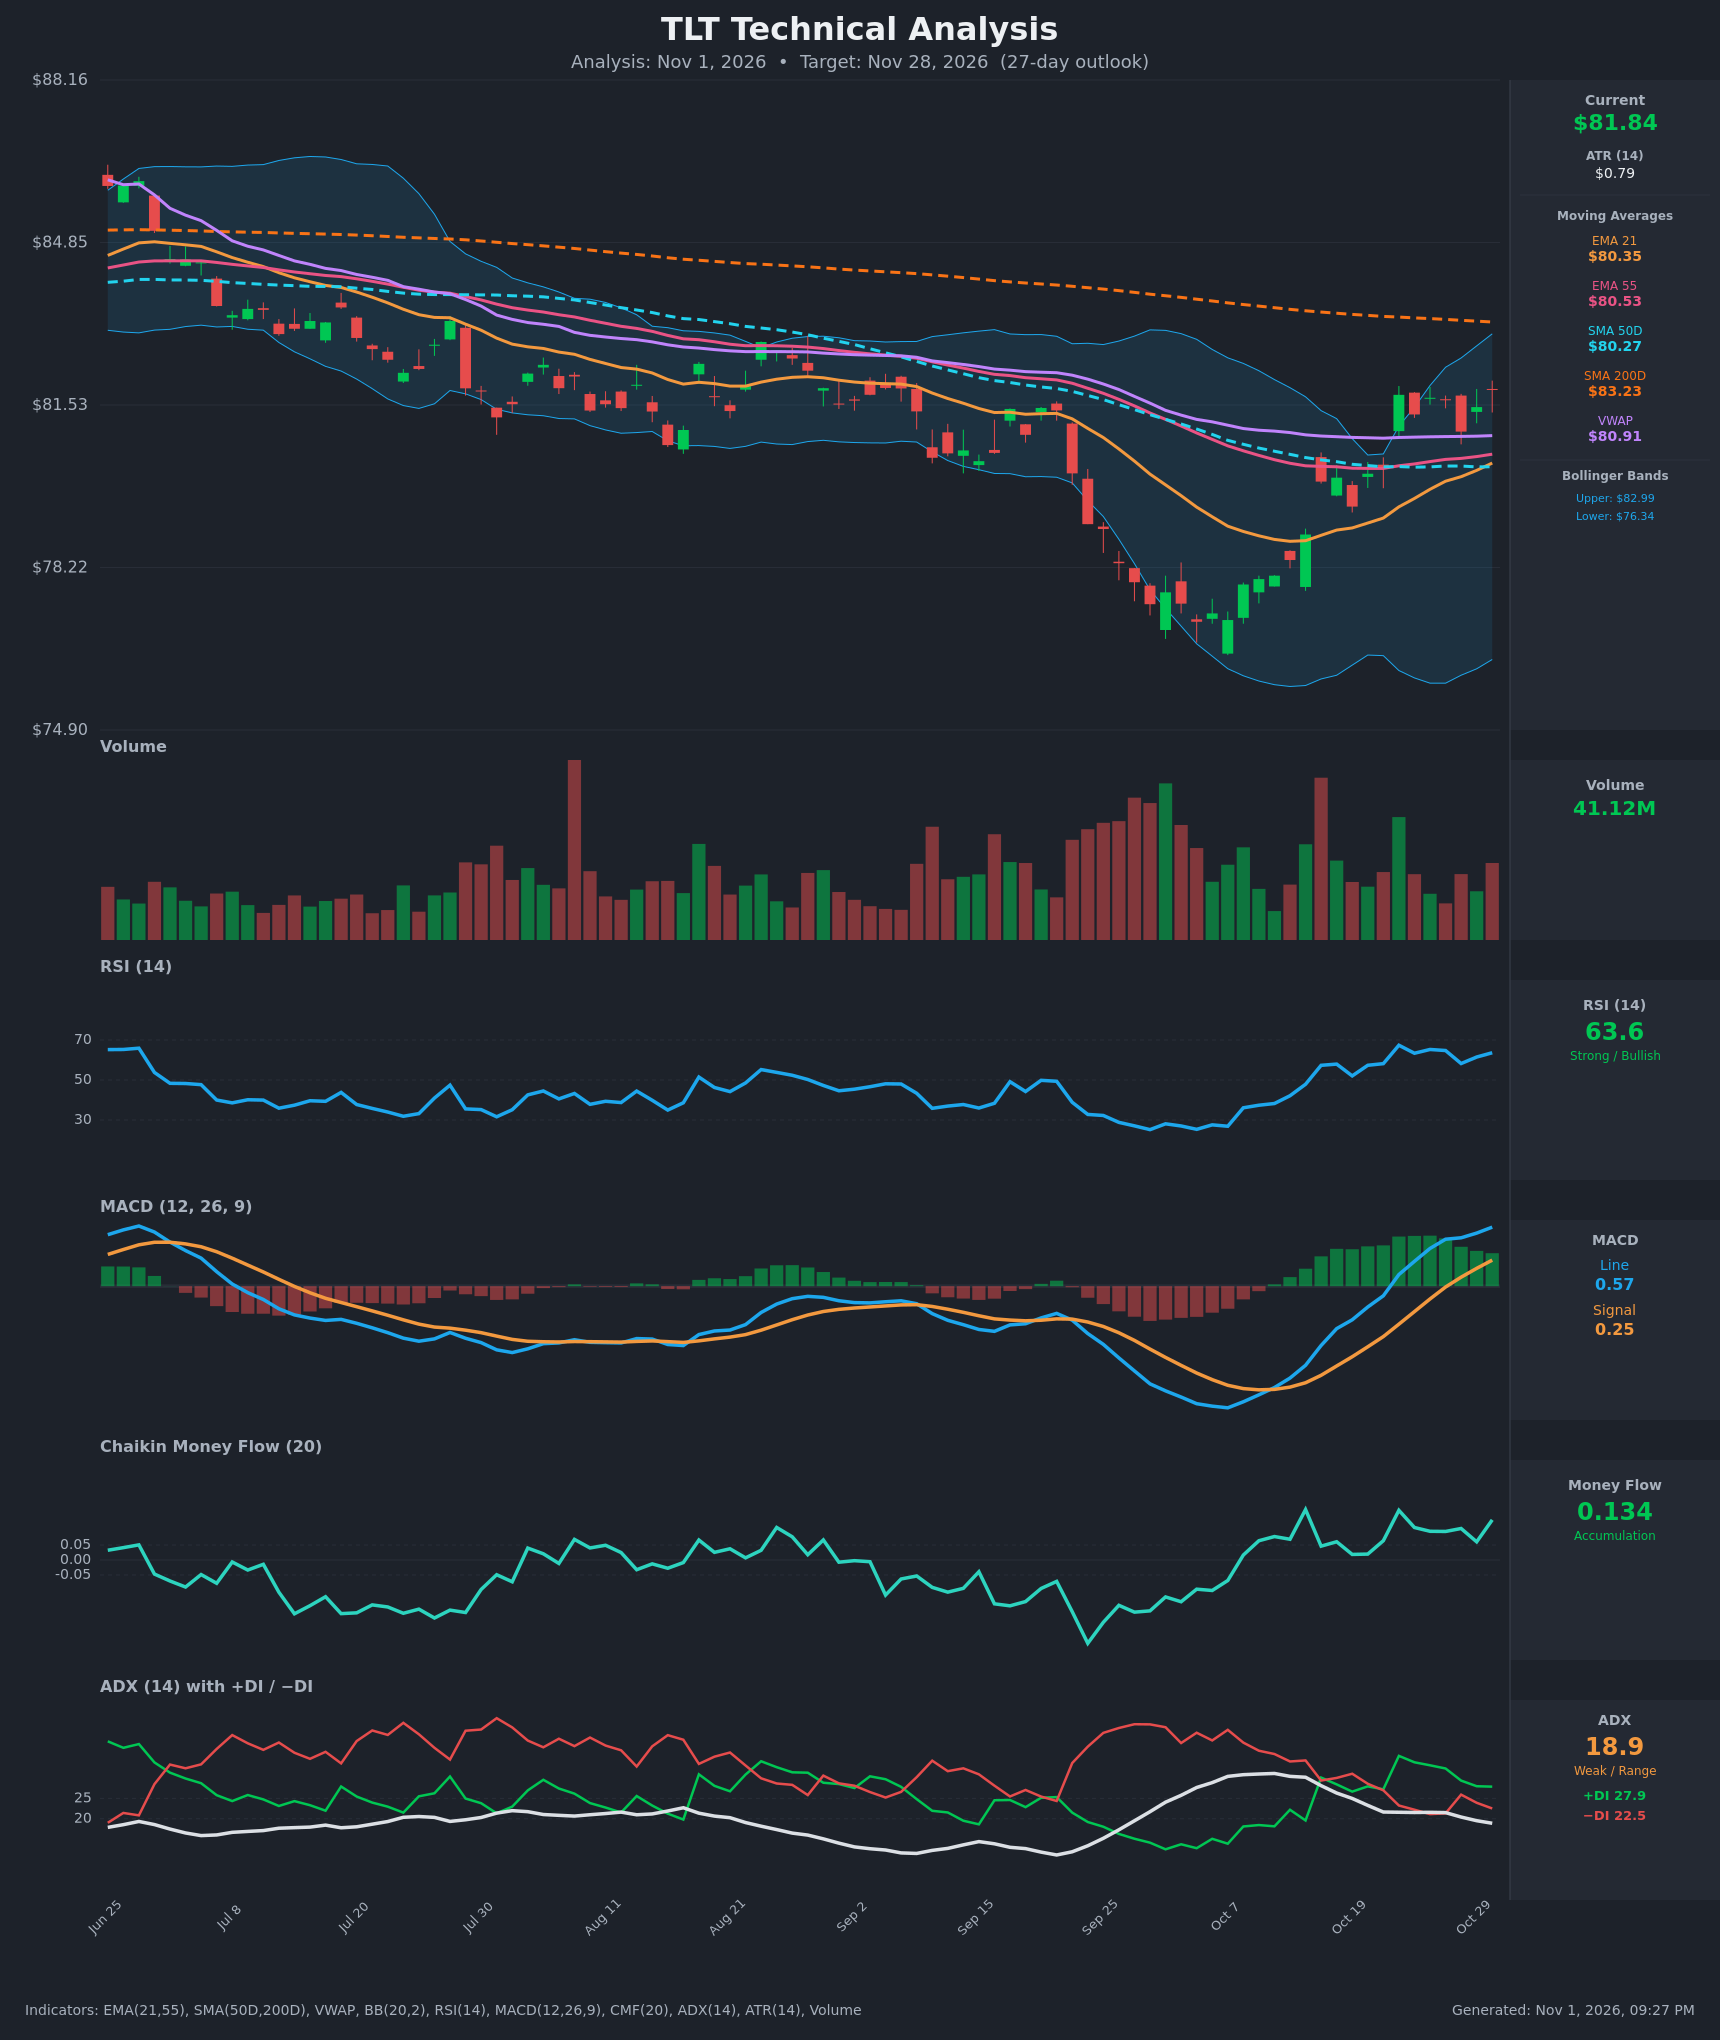
- RSI (14): 63.63, up from the 38 area on Oct 12 and the high-20s/low-30s lows in late September. It is strong but not yet overbought (>70), with room to run. The Oct 22 peak was 67.4, which may act as a short-term ceiling. [Bullish]
- 20 EMA: EMA21 is $80.35 and price at $81.84 is about 1.9% above it. The EMA21 has been rising since Oct 14 and is now crossing above EMA55 ($80.53) from below. A bullish EMA cross is imminent, and both averages should act as support on pullbacks. [Bullish]
- MACD: The line (0.571) crossed above the signal (0.252) on about Oct 27–28 and both are now above zero. The histogram is positive at about +0.32, but it has stopped expanding and has gone flat to slightly lower over the last few bars. [Bullish]
- Bollinger Bands (20): Upper is $82.99, lower is $76.34, and the middle band is about $79.66. Price sits in the upper half of the bands, about $1.15 below the upper band. The bands are wide after the September–October selloff, so volatility is elevated. The band is roughly $2.5 wide above price, so there is room for a modest push before a band-walk is confirmed. [Bullish]
- CMF (20): 0.134, above the +0.05 threshold and positive for most of the last 3 weeks. This shows sustained accumulation, and it confirms the price recovery. [Accumulation]
- ADX (14): 18.9, falling from 31 on Oct 12, so the old downtrend has lost its strength. +DI (27.9) is above −DI (22.5), which puts bulls in control. However, ADX is below 20, so a new trend is not yet established. [Weak Trend + Bullish lean]
- Volume: 41.12M, in line with the recent average. The heaviest volume came during the late-September selloff and the early-October capitulation low, which suggests selling exhaustion. The bounce has been on moderate volume with green bars on the strongest days. [Neutral-to-supportive]
DIVERGENCES & TRENDS
- Price made a lower low around Oct 7 (~$76.5). The RSI low at that point (~high 20s) was lower than the earlier lows, so there is no clean bullish divergence. The momentum recovery since then has been sharp and confirmed by MACD and CMF.
- MACD bottomed well before price and has been climbing steadily. The line is now at its highest level in the visible window, a positive momentum shift.
- Price has reclaimed EMA21, EMA55, SMA50D ($80.27) and VWAP ($80.91). The 4-way cluster near $80.3–$80.9 is now support.
- The EMA21/EMA55 bullish cross is imminent.
- SMA50D ($80.27) remains well below SMA200D ($83.23). This is a death-cross structure, so the long-term trend is still down. Price is also below SMA200D, which is declining at a slow rate and acts as overhead resistance.
- ADX is falling (31 → 18.9) as +DI crosses over −DI. This is a trend-exhaustion signal for the downtrend, but it also means the new uptrend is unproven.
CHART PATTERNS
- Bullish Falling Wedge / downtrend-channel breakout (reversal): The June–October decline traced a descending channel with a capitulation low in early October. The bounce has taken price through the upper channel boundary and above the 21/55 EMAs. The measured move targets the prior range highs near $83–$85.
- Possible Bullish Double Bottom: Lows near ~$76.5 in early October and ~$77–78 earlier have formed a base, but the structure is not a textbook match.
- Resistance cluster: SMA200D at $83.23 and the upper Bollinger Band at $82.99 form the key hurdle. A pattern completion needs a close above $83.2.
POTENTIAL SCENARIOS
- Scenario 1: Bullish Reversal Continuation to SMA200D — Momentum, accumulation, and the reclaimed moving averages push price toward the SMA200D / upper-band zone. Trigger: hold above $80.3 and a close above the Oct 22 high (~$81.74) with CMF staying above 0.05. Target: $83.2, with an extension to $84.5–$85 on a breakout. Invalidation: daily close below $80.0. (55% probability)
- Scenario 2: Bearish Rejection and Retest of the Lows — Price stalls at the SMA200D / upper band, as sellers defend the long-term downtrend. RSI rolls over from 65 and MACD histogram turns negative. Trigger: rejection near $83 or a close below the EMA21 ($80.35). Target: $78.5, then the $76.5 low. Invalidation: close above $83.5. (30% probability)
- Scenario 3: Neutral Consolidation — Price chops between the moving-average cluster and SMA200D while ADX stays below 20. Trigger: failure to break either $80.3 or $83.2. Target: $80.5–$82.5. Invalidation: a decisive close outside that range. (15% probability)
PRICE TARGETS
- Target Price: $83.10 (27-day)
- Expected Range: $77.40 to $86.40 (width $9.00, ≈11% of current price, in line with the 21–30 day guidance)
- Key Levels: Support at $80.35 (EMA21 / SMA50D cluster), Resistance at $83.23 (SMA200D)
OVERALL BIAS
OVERALL BIAS: BULLISH - MACD bullish crossover above zero, RSI at 63.6, CMF showing accumulation, +DI above −DI, and price reclaiming the EMAs, SMA50D and VWAP after a capitulation low. The SMA200D at ~$83.2 is the main overhead hurdle and limits the upside, and ADX below 20 keeps conviction moderate.
This is educational analysis and not financial advice.