TSLA 27-day bullish forecast — Nov 1, 2026
- Bias: Bullish
- Timeframe: 27 days (made Nov 1, 2026, target date Nov 27, 2026)
- Price at analysis: $399.81
- Price target: $414.00
- Expected range: $372.00 – $436.00
- Result: Pending — graded after the close on Nov 27, 2026
Get a free AI analysis of TSLA today
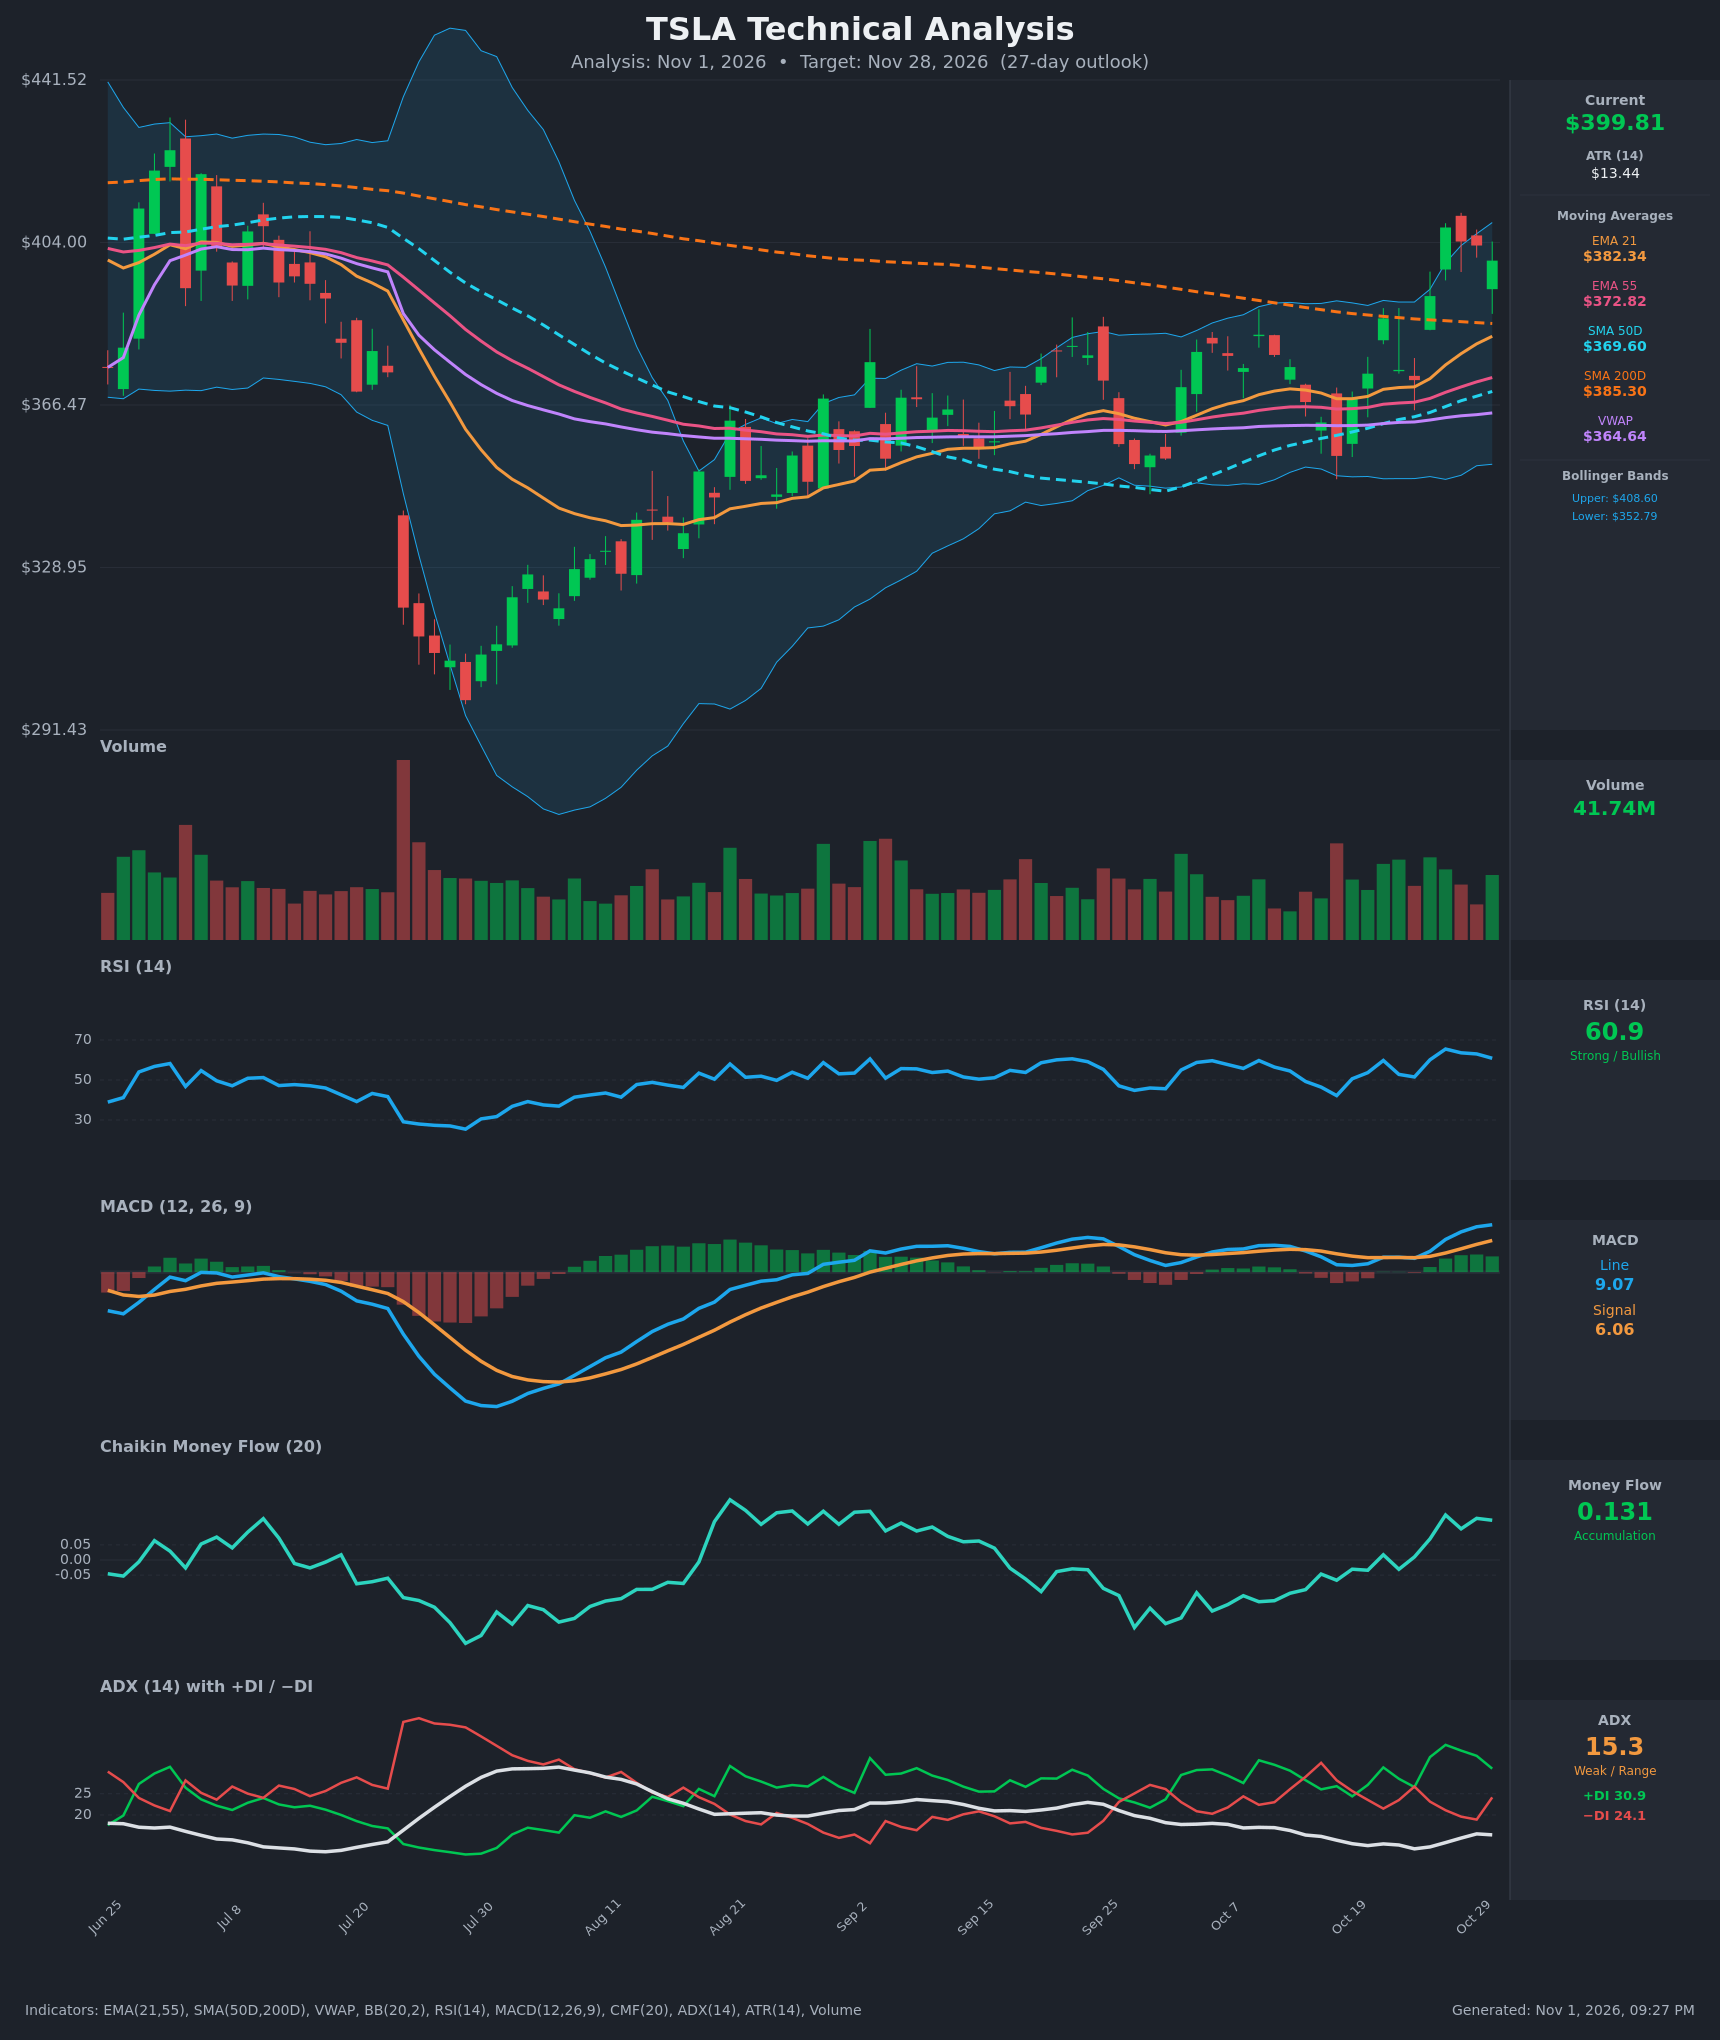
Analysis
TECHNICAL INDICATORS
- RSI (14): 60.86, up from the low 40s on Oct 16 (42.2). It peaked at 65.5 on Oct 27 and has eased slightly. It is in bullish territory with room before 70. [Bullish]
- 20 EMA: The EMA 21 is $382.34 and rising fast. Price at $399.81 is about 4.6% above it, and the EMA 21 has been above the EMA 55 ($372.82) since early October. It is the first dynamic support on a pullback. [Bullish]
- MACD: The line (9.07) is above the signal (6.06) and both are rising. The histogram is positive and widening. The bullish crossover happened around Oct 21, and the line is now at its highest in the recent window. [Bullish]
- Bollinger Bands (20): Upper $408.60, lower $352.79, midline about $380.70. Price is in the upper quarter of the bands, which have been expanding after a long squeeze. The Oct 27 close of $407.46 tagged the upper band and price has pulled back slightly. This is a breakout from compression but also short-term stretched. [Bullish]
- CMF (20): 0.131, well above +0.05. It has turned from negative (-0.135 on Oct 12) to sustained positive readings since Oct 26, which shows real buying pressure behind the rally. [Accumulation]
- ADX (14): 15.3, below 20, so there is no established trend yet. +DI (30.9) is above −DI (24.1), so bulls have the edge, but −DI ticked up on the last bar (19 to 24). The move is directional but not yet confirmed by trend strength. [Weak Trend + Bullish lean]
- Volume: 41.74M on the latest bar, roughly average. Up days on Oct 26-27 had solid volume and the pullback bars are lighter, but there is no large volume surge confirming the breakout. [Neutral-to-mildly bullish]
DIVERGENCES & TRENDS
- There is no meaningful price/RSI or price/MACD divergence. MACD and RSI both made higher highs along with price, and CMF confirms.
- ADX is the weak link. It is at 15.3 while price has risen about 13% from the Oct 16 low ($354.72), so the rally is not yet a mature trend. This raises the risk of a failed breakout back into the range.
- Price has reclaimed the SMA200D ($385.30) after being below it. The SMA50D ($369.60) is still below the SMA200D, so no golden cross has occurred, but the gap is narrowing (about $15.70). The SMA200D is declining and the SMA50D is rising, so a golden cross is plausible within weeks if price holds.
- Price is above VWAP ($364.64), EMA 21, EMA 55, SMA50D and SMA200D, so the moving-average stack is bullish.
- A bullish EMA 21 > EMA 55 alignment is in place, and +DI crossed back above −DI on Oct 26.
- The Oct 27 high of about $407 and the upper band at $408.60 form near-term resistance. Price has stalled below it for three sessions.
CHART PATTERNS
- Breakout from a multi-week consolidation (ascending-triangle-like): From mid-Aug to Oct, price made higher lows (about $345 to $355) against a flat ceiling near $385-390 (SMA200D area). The Oct 26-27 surge broke that ceiling. Using the Ascending Triangle reference, the measured move (height about $40 added to the $385 breakout) points to about $425, with a stretch target near $435-440, the zone of the earlier July gap.
- Recovery from the July low: A broad V/rounded recovery from about $300 to $400, similar to a Bullish Inverted Head and Shoulders or double-bottom base structure. It is incomplete until the prior high area ($430-440) is retaken.
- Risk pattern: The two highs at $407.46 (Oct 27) and about $404 (Oct 28-29) could develop into a Bearish Double Top. The neckline would be near the $372-382 area (EMA 21 and the Oct 23 low). A close below $382 would activate this.
POTENTIAL SCENARIOS
- Scenario 1: Bullish Breakout Continuation — Price consolidates briefly, holds above the SMA200D and EMA 21, then pushes through the Oct 27 high and the upper Bollinger Band. CMF and MACD stay positive and a golden cross becomes possible. Trigger: daily close above $408.60 on above-average volume. Target: $425 initially, then $435. Invalidation: daily close below $382 (EMA 21). (50% probability)
- Scenario 2: Neutral Range Digestion — After a 13% run, price chops between the EMA 21 and the upper band while ADX stays low and the stock ends the period near current levels. Trigger: failure to close above $408 while holding above $385. Target: $390-$405. Invalidation: close above $410 or below $380. (20% probability)
- Scenario 3: Bearish Failed Breakout / Double Top — The Oct 27 high holds as resistance, price falls back below the SMA200D, and the weak-ADX rally is exposed as a range bounce. Trigger: close below $385, then $382. Target: $370, then $355 (lower band, SMA50D area). Invalidation: close back above $408.60. (30% probability)
PRICE TARGETS
- Target Price: $414.00 (27-day horizon)
- Expected Range: $372.00 to $436.00 (width $64 = 16% of the current price, in line with the 12-18% guidance for 30-60 days scaled to 27 days)
- Key Levels: Support at $382.34 (EMA 21; then $369.60 SMA50D), Resistance at $408.60 (upper Bollinger Band / recent high at about $407.5; next at $425-$435)
OVERALL BIAS
OVERALL BIAS: BULLISH - Price has broken above the SMA200D, EMA 21/55, SMA50D and VWAP, with a rising MACD histogram, RSI at 61 with room to run, and CMF showing clear accumulation. The weak ADX (15.3) and the stall below $408 keep conviction modest, with $382 the level to hold.
This is educational analysis and not financial advice.