TQQQ 27-day bearish forecast — Nov 1, 2026
- Bias: Bearish
- Timeframe: 27 days (made Nov 1, 2026, target date Nov 27, 2026)
- Price at analysis: $62.01
- Price target: $59.00
- Expected range: $54.00 – $65.00
- Result: Pending — graded after the close on Nov 27, 2026
Get a free AI analysis of TQQQ today
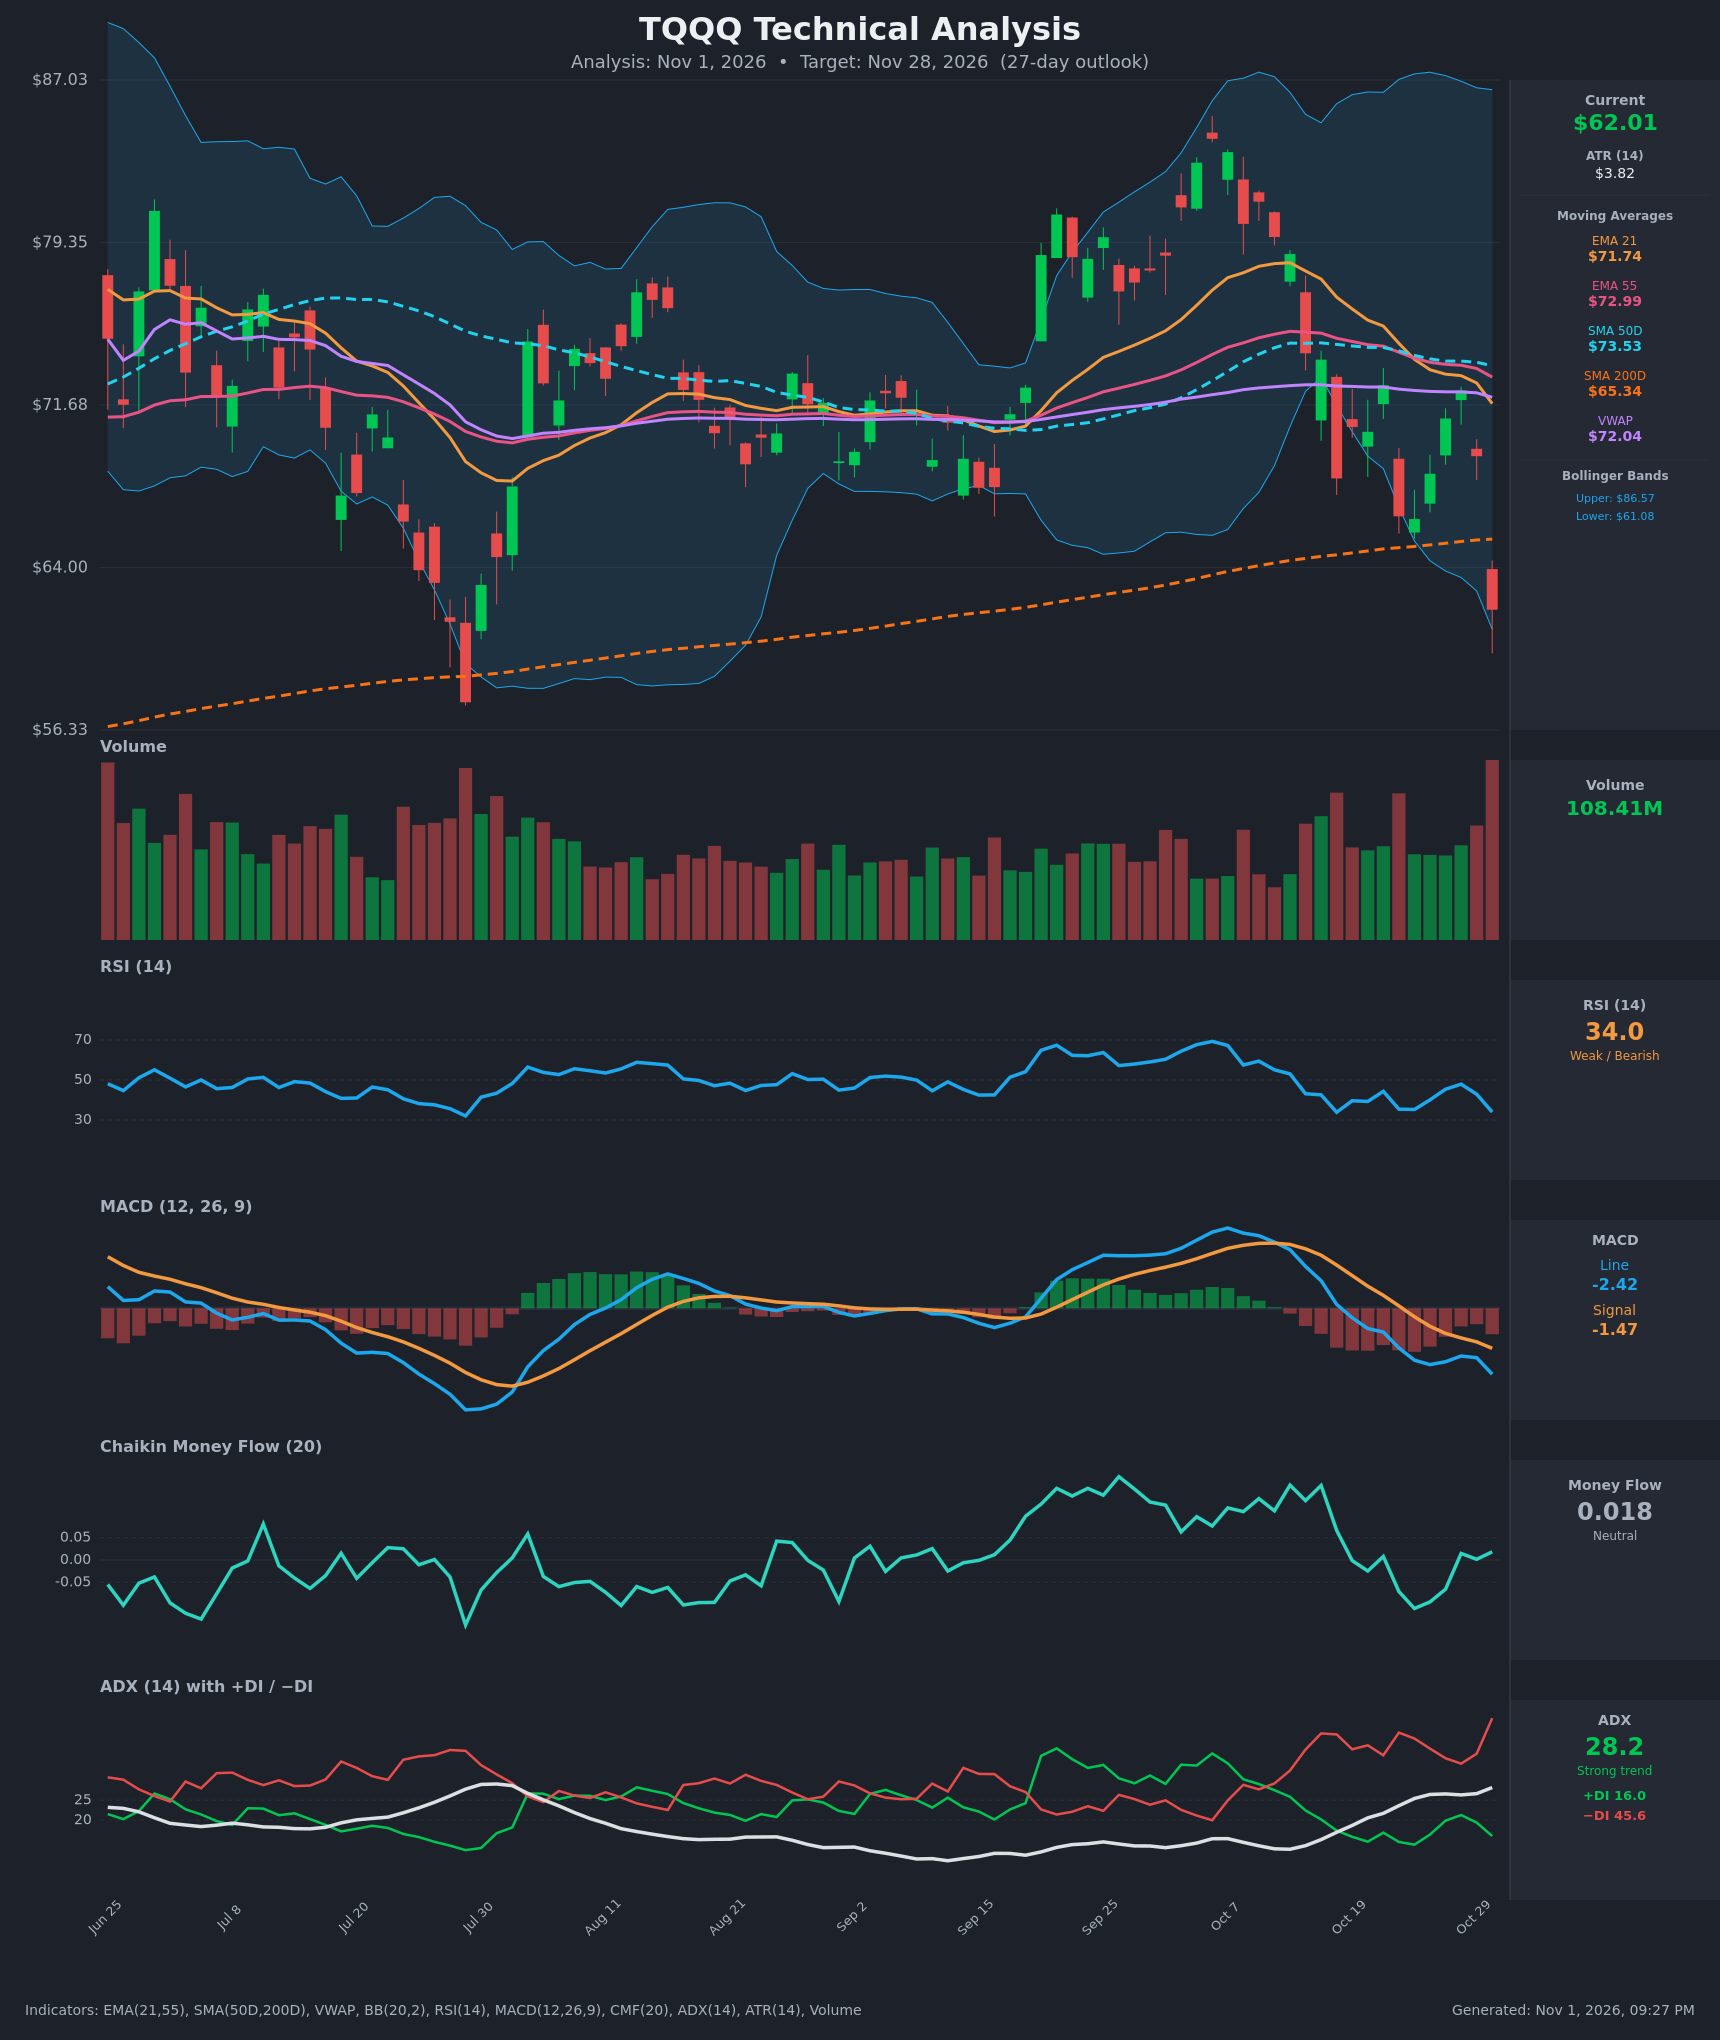
Analysis
TECHNICAL INDICATORS
- RSI (14): 33.96, just above oversold (30) and falling from about 48 on Oct 28. Momentum is weak, and the Oct 16 low of 33.9 was followed by only a brief bounce. [Bearish]
- 20 EMA: The 21 EMA is $71.74, and price at $62.01 is about 13.6% below it. The EMA is sloping down and acting as strong overhead resistance. EMA21 ($71.74) is also below EMA55 ($72.99), a bearish cross that occurred around Oct 23. [Bearish]
- MACD: The line (-2.42) is below the signal (-1.47) and both are below zero. The bearish crossover occurred around Oct 22-23, and the histogram is widening negative again after a brief narrowing. [Bearish]
- Bollinger Bands (20): Price is at $62.01 against a lower band of $61.08, so it is hugging the lower band after a roughly 10.5% single-day drop. The bands are wide (upper $86.57), which signals high volatility. A band-walk is possible, but a snap-back toward the $72 midline is also possible. [Bearish]
- CMF (20): 0.018, between ±0.05, recovering from the -0.108 low. It shows no strong accumulation or distribution, and the latest crash has not pushed it into distribution yet. [Neutral]
- ADX (14): 28.2 and rising, above 25, so the trend is strong. −DI at 45.6 is far above +DI at 16.0, so sellers firmly control the move. [Strong Trend – Bearish]
- Volume: 108.41M, the highest bar on the chart, on a large red candle. This is heavy-volume distribution and a breakdown, though it could also mark a capitulation or climax. [Bearish with possible capitulation]
Price is also below VWAP ($72.04), SMA50D ($73.53) and, critically, SMA200D ($65.34), which it just lost.
DIVERGENCES & TRENDS
- There is no clear bullish RSI divergence. RSI at 34 is about equal to the Oct 16 reading (33.9), while price is lower ($62.01 vs $68.21). Price made a lower low with a similar RSI, which is a mild warning rather than a divergence.
- MACD rolled over after the late-Sep/early-Oct peak and is making new lows. Momentum is clearly deteriorating.
- Price has lost the SMA200D ($65.34) for the first time since early August. The 50D/200D gap is still positive ($73.53 vs $65.34), so there is no death cross, but the long-term trend support has failed.
- The trend sequence has been lower highs ($85 → $79.6 → $72.4) and lower lows ($68.2 → $66.3 → $62.0). The EMA21/55 bearish cross and the −DI surge confirm a downtrend.
- CMF is flat near zero, so selling has not shown persistent distribution. That slightly tempers the bearish case.
CHART PATTERNS
- The closest reference pattern is a Bearish Head and Shoulders / lower-high sequence. The Sep–Oct rally peaked near $85, and the failed bounces to $72 formed a lower high beneath it. Price has now broken under the roughly $66 neckline zone and the SMA200D.
- The downtrend since the early-October peak is best read as a continuation structure with a break of support. A measured move of the $85 → $66 decline suggests a downside extension toward the mid/high-$50s. This lines up with the July low (about $57-58).
- A Bullish Double Bottom is a possible alternate pattern if price retests the $57-58 July low and holds. That is not confirmed yet.
POTENTIAL SCENARIOS
- Scenario 1: Bearish Trend Continuation toward July Lows — Strong −DI dominance, a rising ADX, a MACD that is still falling and the loss of SMA200D support point to further downside. Price likely tests the July low area. Trigger: daily close below $60 / lower Bollinger Band walk. Target: $57-$59. Invalidation: daily close back above $65.34 (SMA200D). (50% probability)
- Scenario 2: Bullish Oversold Relief Bounce — A high-volume capitulation bar with RSI near 30 and price at the lower band could produce a snap-back, as TQQQ is a volatile 3x ETF. Trigger: close above $66 on rising volume. Target: $69-$72 (EMA21/VWAP). Invalidation: a break below $57.50. (35% probability)
- Scenario 3: Neutral Range Base — Price consolidates between the July low and the SMA200D. Trigger: ADX falling below 25 and RSI stabilizing around 35-45. Target: $59-$65. Invalidation: a decisive break outside that range. (15% probability)
PRICE TARGETS
Self-check: the 27-day range is $54.00 to $65.00, a width of $11.00, or about 17.7% of the $62.01 current price. That is within the 12-18% guidance for 30-60 days and appropriately wider than a short-term range.
- Target Price: $59.00 (27 days)
- Expected Range: $54.00 to $65.00
- Key Levels: Support at $57.50 (July low area), Resistance at $65.34 (SMA200D)
OVERALL BIAS
OVERALL BIAS: BEARISH - Price is below all key moving averages and the SMA200D. ADX is rising with −DI (45.6) far above +DI (16.0), and MACD is bearish and falling. Conviction is modest because the heavy-volume drop to the lower Bollinger Band and RSI near 34 raise the odds of a relief bounce, but the trend evidence favors a drift toward the July lows near $57-59.
This is educational analysis and not financial advice.