WMT 27-day bullish forecast — Nov 1, 2026
- Bias: Bullish
- Timeframe: 27 days (made Nov 1, 2026, target date Nov 27, 2026)
- Price at analysis: $123.51
- Price target: $126.00
- Expected range: $114.50 – $132.00
- Result: Pending — graded after the close on Nov 27, 2026
Get a free AI analysis of WMT today
Analysis
TECHNICAL INDICATORS
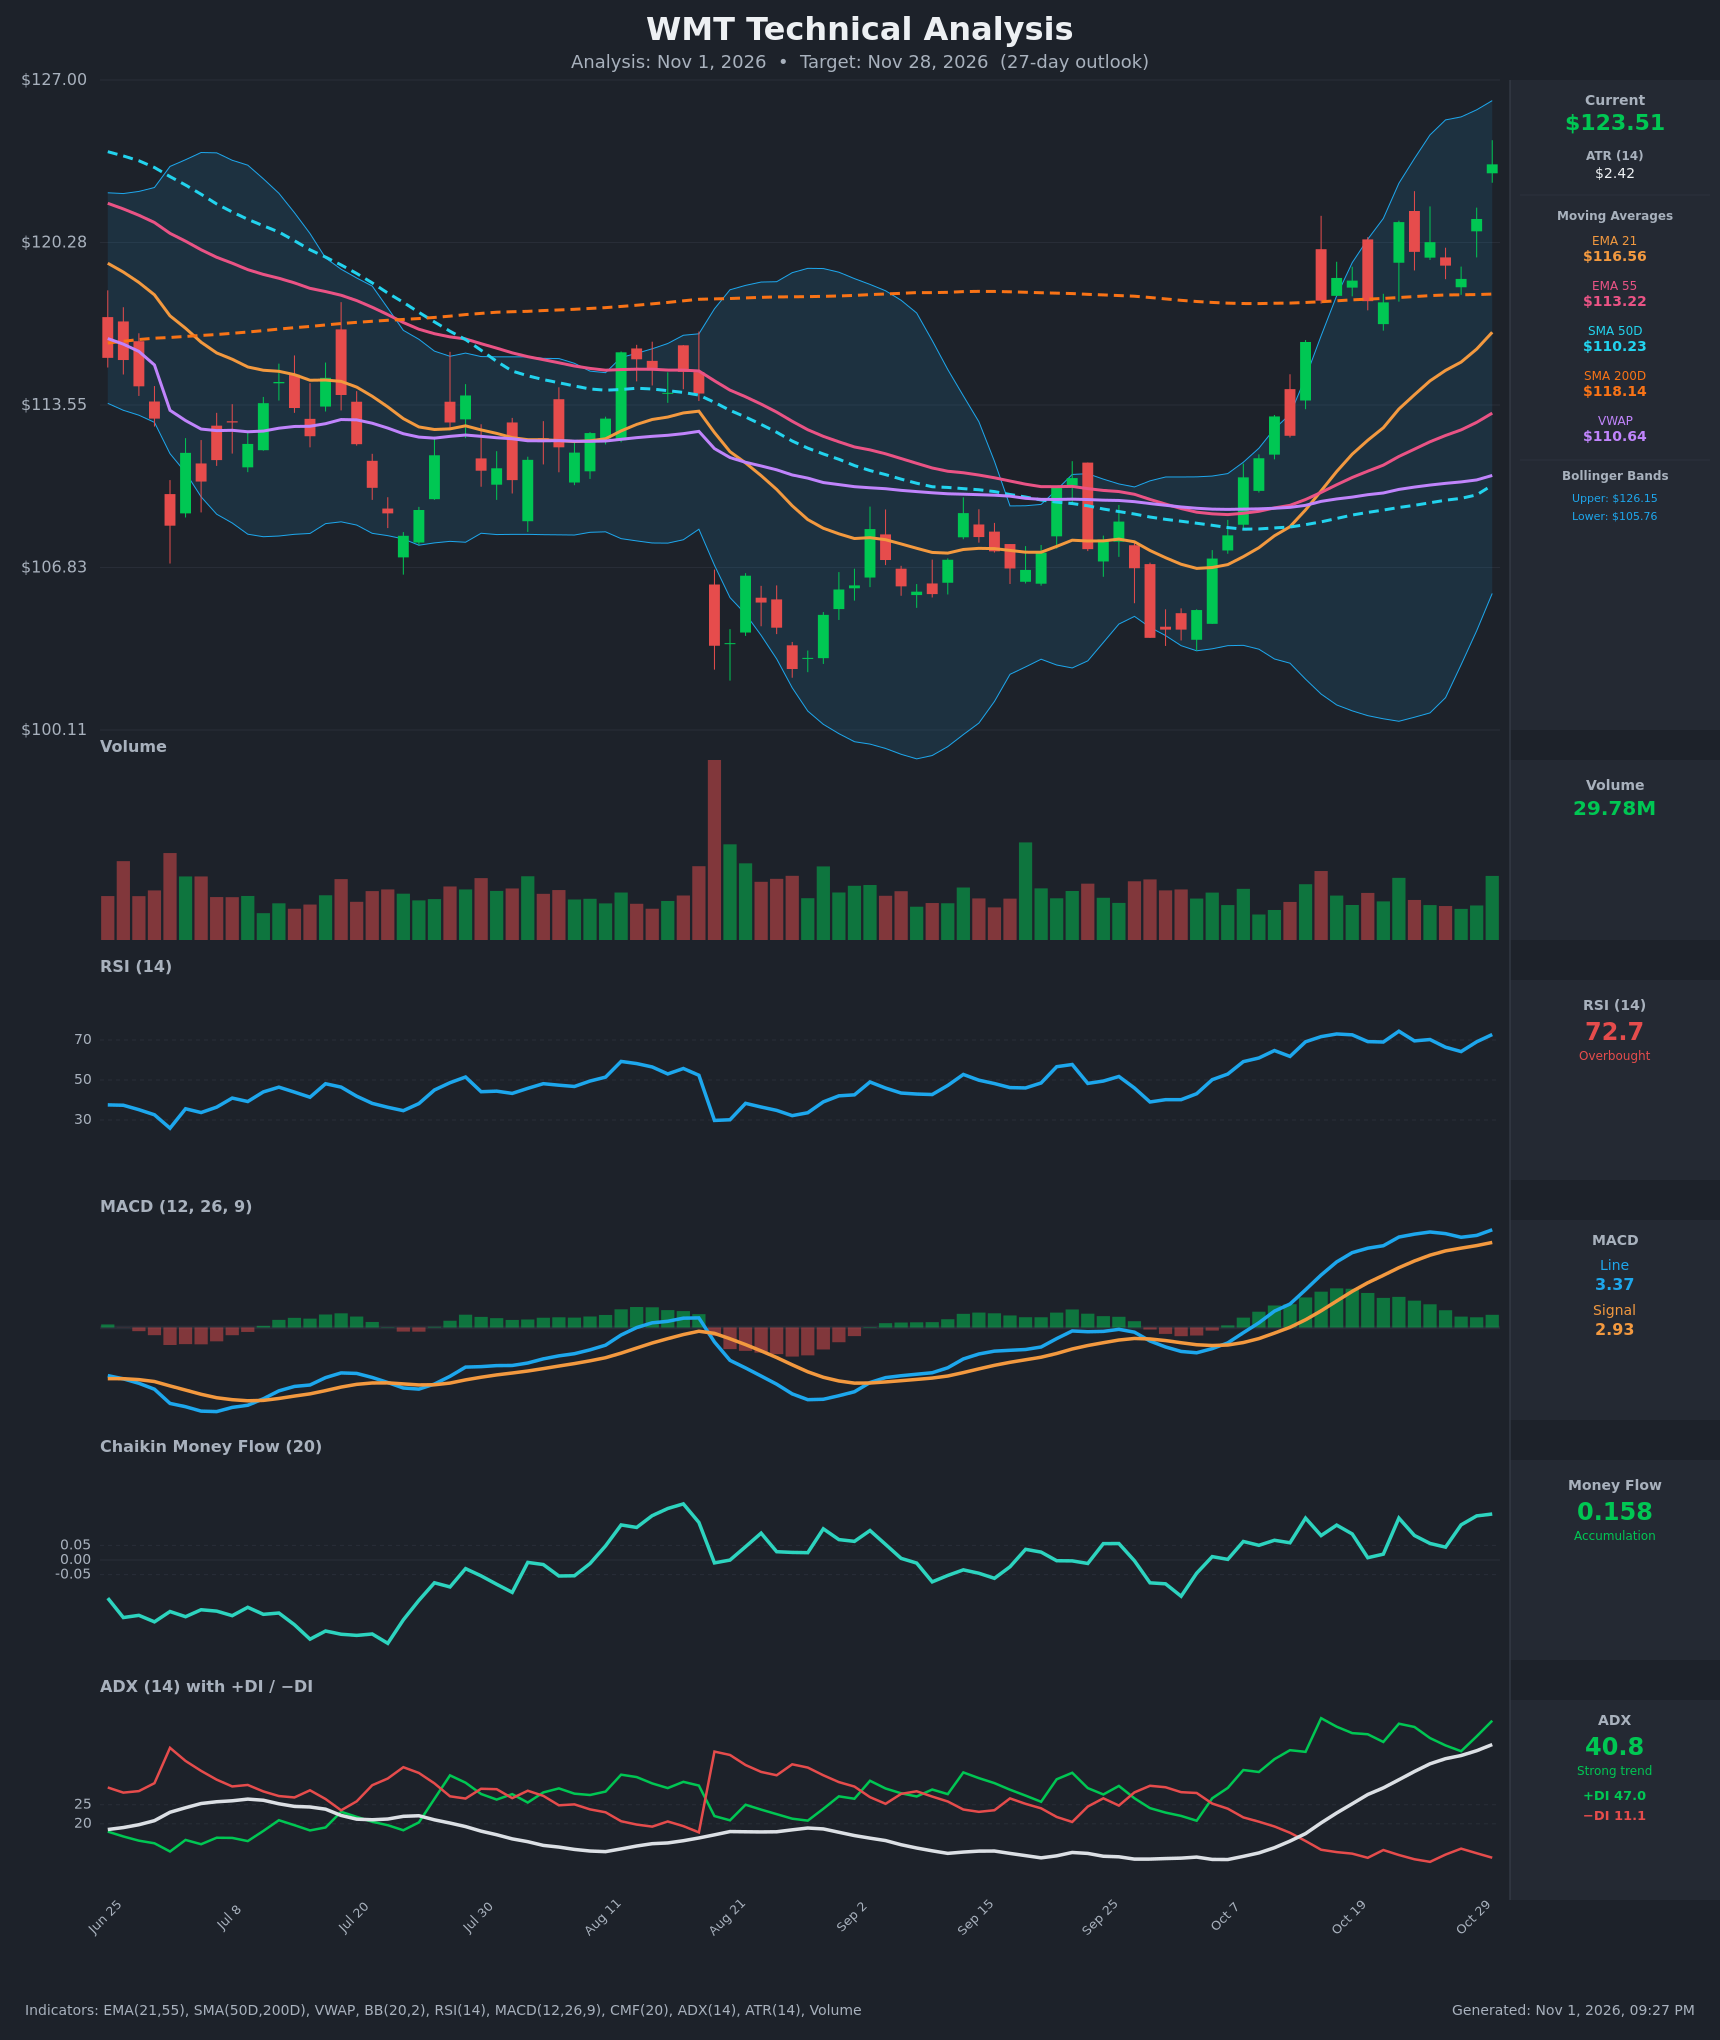
- RSI (14): 72.74, in overbought territory. It peaked at 74.4 on Oct 22, dipped to 64.2 on Oct 28, and has rebounded to 72.7 with price at a new high. Momentum is strong but stretched, and overbought readings in strong trends can persist, but upside is more fragile from here. [Bullish (overbought caution)]
- 20 EMA: The supplied value is the EMA 21 at $116.56. Price at $123.51 is about 6% above it, and the EMA is rising steadily, so it acts as dynamic support. EMA21 is above EMA55 ($113.22), which confirms the short-term uptrend. The gap does mean price is extended. [Bullish]
- MACD: The line (3.371) is above the signal (2.934) with a positive histogram of about +0.44. The histogram peaked near Oct 22 and faded before ticking up again in the last two bars. The trend is intact, though momentum has been less impressive than price. [Bullish]
- Bollinger Bands (20): Upper is $126.15, lower is $105.76, and the middle is about $116. Price is in the upper quarter of the band, roughly $2.6 below the upper band. The bands are expanding, which signals a volatility breakout. Price can "walk the band" in strong trends, but it has little room before the upper band. [Bullish (extended)]
- CMF (20): 0.158, well above +0.05, and positive for most of October. This shows sustained accumulation that backs up the price advance. [Accumulation]
- ADX (14): 40.8 and rising steadily from 13.7 on Oct 12, with +DI at 47.0 far above −DI at 11.1. This is a strong, mature trend with bulls firmly in control. ADX above 40 also warns that the trend is getting mature, so exhaustion or consolidation risk is rising. [Strong Trend + Bullish]
- Volume: 29.78M, with the latest green bar larger than the recent average. The Oct 30 breakout to a new swing high came on above-average participation, but volume is not climactic. This supports the move without showing blow-off exhaustion. [Mildly Bullish confirmation]
DIVERGENCES & TRENDS
- Minor bearish divergence: RSI made a lower high (72.7 vs 74.4 on Oct 22) while price made a higher high. The MACD histogram also peaked around Oct 22 and has faded since. Neither is a strong warning on its own, but together they suggest a pullback or consolidation is possible.
- Trend alignment:
- EMA21 is above EMA55 and both are rising.
- EMA21 is approaching the SMA200 from below at $118.14. Price has already reclaimed the SMA200, which is a long-term bullish shift.
- A golden cross has not occurred. SMA50D ($110.23) is still well below SMA200D ($118.14), so the long-term crossover is not yet confirmed.
- Crossovers: The MACD bullish crossover happened in early October and has held. +DI has been above −DI throughout the move. ADX crossed above 25 on Oct 19 and is still rising.
- VWAP: Price at $123.51 is about 12% above VWAP ($110.64), which shows strong buying but also extension from the mean.
- Price vs 200-day: Price is above the SMA200 (about +4.5%), which flips the long-term bias from down to up.
CHART PATTERNS
- Bullish Double Bottom / Triple-bottom base:
- The lows near $103–104 in late Aug and late Sep form a base.
- The October rally through the $118 zone (the SMA200 and prior range top) acts as the neckline breakout.
- The measured move is the base depth (~$14) added to the neckline (~$118), which gives about $132. This is the long-run upside objective and sits at the top of the expected range.
- Bullish Pennant / Flag (small scale): The Oct 20–28 consolidation between roughly $117.8 and $121 was a tight pause after the impulse. The breakout from it on Oct 29–30 resumes the uptrend.
- Caution: The immediate upside is capped near the upper Bollinger Band at $126.15. A rising wedge could develop if price grinds higher on fading momentum, though that is not confirmed yet.
POTENTIAL SCENARIOS
- Scenario 1: Bullish Trend Continuation — Strong ADX, +DI dominance, accumulation (CMF) and a MACD above signal support further gains, possibly with a brief pause near the upper band first. Trigger: a daily close above $126.15 (upper Bollinger Band) on solid volume. Target: $126–$130, with the measured-move extension near $132. Invalidation: a daily close below $118.14 (SMA200 and breakout zone). (50% probability)
- Scenario 2: Bearish Overbought Pullback — RSI above 70, price extended 6% above EMA21 and 12% above VWAP, and the minor RSI/MACD histogram divergence invite mean reversion toward the EMA21 zone. Trigger: a bearish candle closing below $120.00 with a MACD histogram turn negative. Target: $116.50–$118.00 (EMA21 and SMA200). Invalidation: a reclaim and close above $124.50–$125. (32% probability)
- Scenario 3: Neutral Consolidation — Price digests the rally and chops between the SMA200 area and the upper band. Trigger: low-volume candles inside $119–$126. Target: $120–$125. Invalidation: a decisive close outside the $118–$127 range. (18% probability)
PRICE TARGETS
- Target Price: $126.00 (27-day horizon, about +2.0% from $123.51; above current price and near the upper Bollinger Band)
- Expected Range: $114.50 to $132.00 (width $17.50, about 14.2% of the current price, consistent with the 12–18% guidance for 30–60 days scaled to 27 days. The ATR of $2.42 supports this: 27 days is roughly 5 ATR-sized swings each way, and the range is skewed above the current price given trend strength.)
- Key Levels: Support at $118.14 (SMA200 and breakout zone), Resistance at $126.15 (upper Bollinger Band)
OVERALL BIAS
OVERALL BIAS: BULLISH - A strong trend (ADX 40.8, +DI 47 vs −DI 11), MACD above signal, sustained accumulation (CMF 0.158), and a break above the SMA200 all favor higher prices. The overbought RSI and the extension from the EMA21 mean gains may be modest ($126 target) and a pullback toward $118–$120 is a real risk.
This is educational analysis and not financial advice.