XLE 27-day bullish forecast — Nov 1, 2026
- Bias: Bullish
- Timeframe: 27 days (made Nov 1, 2026, target date Nov 27, 2026)
- Price at analysis: $70.02
- Price target: $71.50
- Expected range: $66.00 – $74.00
- Result: Pending — graded after the close on Nov 27, 2026
Get a free AI analysis of XLE today
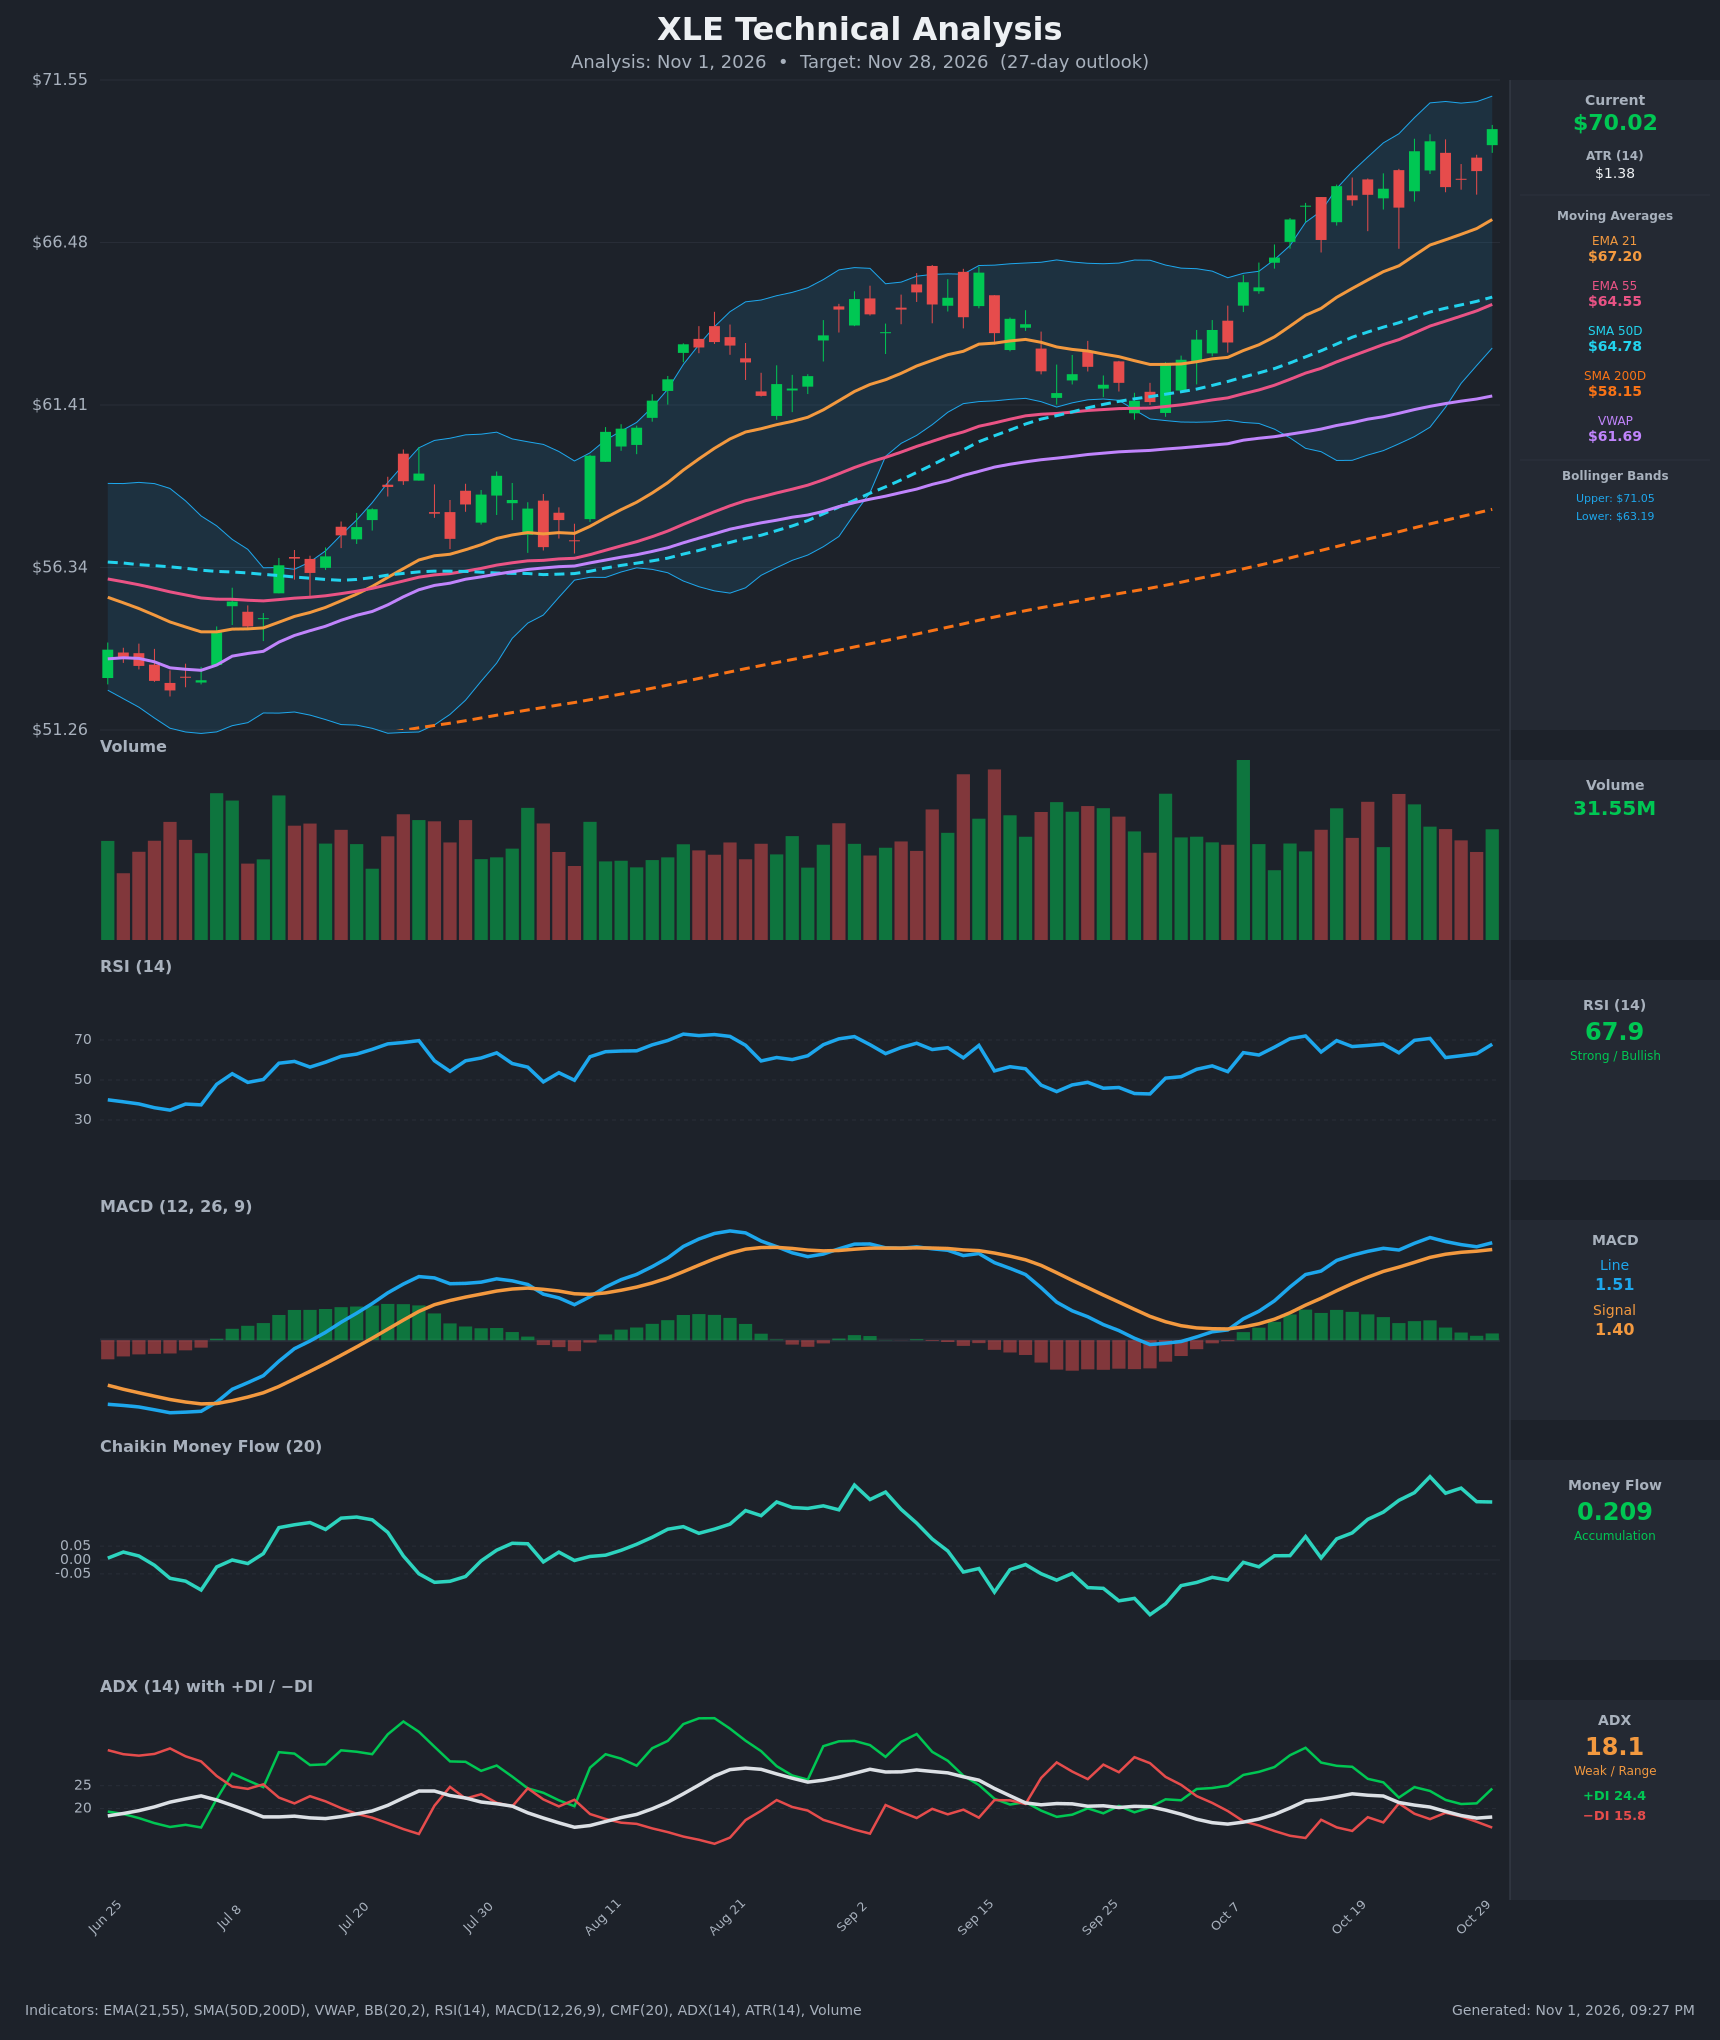
Analysis
TECHNICAL INDICATORS
- RSI (14): 67.88, just under the 70 overbought line. It has oscillated between 61 and 72 over the last 15 bars and made a higher low on the Oct 27 dip (61.2). Momentum is strong, but upside is limited if it stalls at 70-72. [Bullish]
- 20 EMA: The EMA 21 is $67.20 and rising steadily, with price about 4.2% above it. The EMA 21 is also well above the EMA 55 ($64.55), so the stack is bullish. Price has not touched the EMA 21 since mid-October, so it is somewhat extended. [Bullish]
- MACD: The line is 1.508 and the signal is 1.404, a positive spread of about 0.10. The histogram is small and positive. The line dipped below the signal in the Oct 27-29 pullback (spread narrowed to roughly 0.07) but never crossed, and it is now re-expanding. Momentum is positive but not accelerating strongly. [Bullish]
- Bollinger Bands (20): Upper $71.05, lower $63.19, with price at $70.02 in the upper 15% of the band. The bands are wide and expanding. Price is "walking" the upper half, which is typical of an uptrend. It is near the upper band, so a short-term pause or pullback toward the midline (~$67.1) is plausible. [Bullish]
- CMF (20): 0.209, well above +0.05, and it has been positive for the whole recent rally, peaking near 0.30 on Oct 26. Buyers are consistently accumulating, and CMF is confirming the price highs. [Accumulation]
- ADX (14): 18.1, below 20, so the trend is weak or range-like by this measure. +DI (24.4) is above −DI (15.8) and has widened again from the Oct 22 near-cross (22.4 vs 21.1). Direction favors bulls, but ADX has been falling from 23, so trend strength is not confirmed. This is the main caveat. [Weak Trend, Bullish direction]
- Volume: 31.55M, roughly average, with no obvious surge on the latest green candle. Several recent up days came on above-average volume, but today's breakout to new highs lacks a volume spike. Participation is supportive but not decisive. [Neutral to mildly Bullish]
DIVERGENCES & TRENDS
- Moving averages: Price ($70.02) is above the EMA 21 ($67.20), EMA 55 ($64.55), SMA50D ($64.78), SMA200D ($58.15) and VWAP ($61.69). The golden cross is long established (SMA50D is far above SMA200D), and both are rising. This is a clean long-term uptrend.
- Price vs. RSI/MACD: Price made a higher high at $70.02, but RSI (67.9) is slightly below its Oct 26 peak (70.8) and MACD (1.508) is slightly below its Oct 26 peak (1.589). This is a mild bearish divergence on a very short horizon, and not yet a signal by itself.
- ADX vs. price: Price is making new highs while ADX falls toward 18. This is a mild warning of a lower-conviction advance.
- CMF: Confirms the rally with strong readings (0.21–0.30), a clear positive.
- Crossovers: There is no EMA or SMA crossover pending, and no MACD bearish cross (it came close on Oct 27-29 and held). +DI re-widened versus −DI after nearly crossing on Oct 22.
- Broader context: The Aug-Sep high (~$65) and the Sep 25-Oct 5 low (~$61) were both cleared, so the old range has been broken to the upside.
CHART PATTERNS
- Ascending Triangle / Bullish Flag-type continuation (Oct 22–30): After the sharp Oct 7-16 leg up, price consolidated in a tight $67.6–$69.6 zone with higher lows, then broke above $69.64 on Oct 30. This matches the continuation breakout structure in the reference diagram. A measured move from the consolidation (~$2) points to roughly $71.50–$72.
- Earlier Aug-Sep double-top-like structure (~$64–$65.5): It did not produce the bearish reversal. The decisive break above it invalidated it, which is bullish. That zone (~$65) is now major support.
- Upper Bollinger/channel resistance: Price is pressing against the upper band ($71.05), where short-term resistance is likely. No bearish reversal pattern (rising wedge, head and shoulders) is complete.
POTENTIAL SCENARIOS
- Scenario 1: Bullish Trend Continuation — Price holds above the breakout zone ($68.50–$69.60) and grinds higher with the rising EMA 21 and CMF accumulation, possibly after a shallow pullback. Trigger: daily close above $71.05 (upper Bollinger Band) with MACD holding above its signal. Target: $71.50–$73.50. Invalidation: daily close below $67.20 (EMA 21). (50% probability)
- Scenario 2: Bearish Mean-Reversion Pullback — Weak ADX, a mild RSI/MACD divergence and an extended price lead to a retracement toward the EMA 21 and SMA50D area. Trigger: failure at $71 followed by a close back below $68.20 and a MACD bearish cross. Target: $66.00–$67.20, with an extension to $64.80 (SMA50D/EMA 55) if momentum fades. Invalidation: close back above $70.50. (30% probability)
- Scenario 3: Neutral Range Digestion — Price consolidates between about $67.50 and $71.00 as ADX stays under 20. Trigger: repeated rejections at the upper band and support at the EMA 21. Target: $68.50–$70.50. Invalidation: close outside $67.00–$71.50. (20% probability)
PRICE TARGETS
- Target Price: $71.50 (27-day, Nov 28, 2026)
- Expected Range: $66.00 to $74.00. The width is $8.00, or about 11.4% of the $70.02 current price, which fits a ~27-day horizon. It is about 2.9x wider than a 3-day range, and the ~1.3 ATR daily scale supports it.
- Key Levels: Support at $67.20 (EMA 21, with $64.78 SMA50D below it), Resistance at $71.05 (upper Bollinger Band, with $72.00 above it)
OVERALL BIAS
OVERALL BIAS: BULLISH - Price is above every key moving average with an established golden cross, CMF shows strong accumulation (0.209), +DI leads −DI, and the breakout from the tight consolidation targets about $71.50. The weak ADX (18.1), the proximity to the upper Bollinger Band and the mild RSI/MACD divergence argue for modest conviction and a possible pullback toward the $67.20 EMA 21 along the way.
This is educational analysis and not financial advice.