KWEB 34-day bearish forecast — Nov 1, 2026
- Bias: Bearish
- Timeframe: 34 days (made Nov 1, 2026, target date Dec 4, 2026)
- Price at analysis: $22.74
- Price target: $22.10
- Expected range: $19.90 – $24.20
- Result: Pending — graded after the close on Dec 4, 2026
Get a free AI analysis of KWEB today
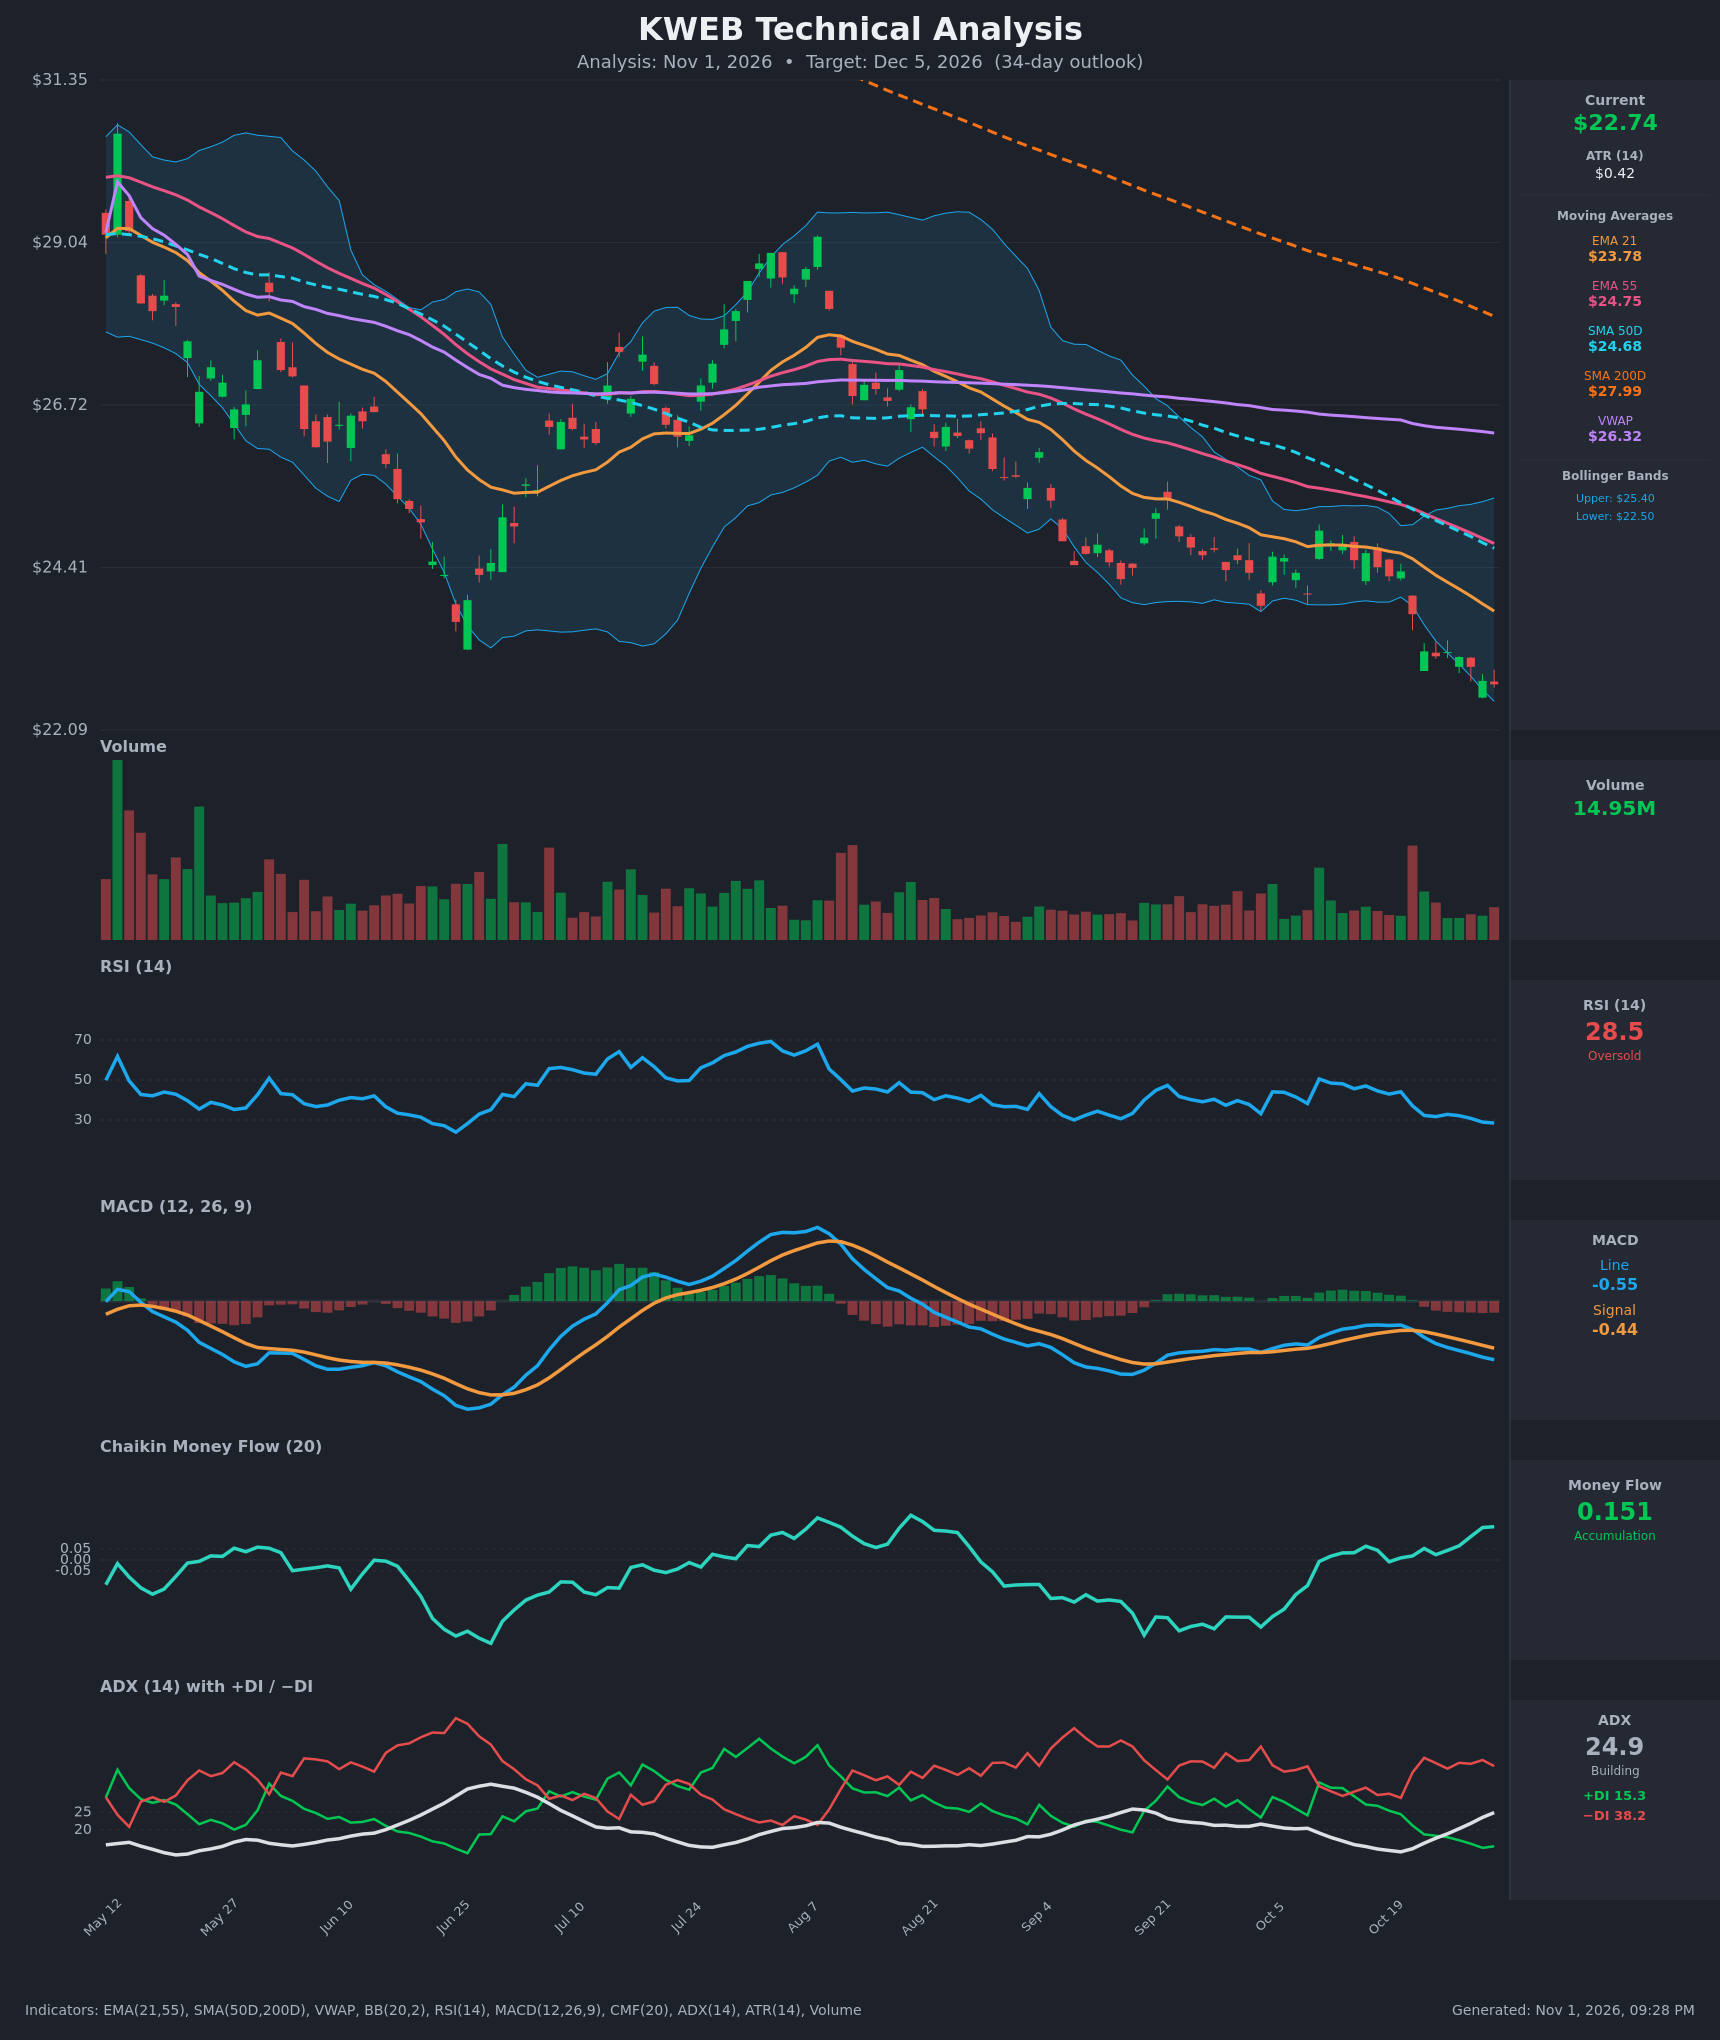
Analysis
TECHNICAL INDICATORS
- RSI (14): 28.48, in oversold territory and declining from about 44 on Oct 20. It has been below 33 for most of the last 7 sessions, so momentum is still pointing down. It has made no bullish turn yet. [Bearish]
- 20 EMA: The data gives EMA 21 at $23.78 and EMA 55 at $24.75. Price at $22.74 is below both, and the gap is widening. EMA21 is below EMA55 and falling, which makes both averages overhead resistance. [Bearish]
- MACD: The MACD line is -0.55, below the signal at -0.44. The bearish crossover occurred around Oct 21-22, and the negative histogram (about -0.11) has been widening. Both lines are below zero. [Bearish]
- Bollinger Bands (20): The bands run from $22.50 to $25.40. Price at $22.74 sits just above the lower band, in a "band walk" down. The bands are not expanding sharply, so a mean-reversion bounce toward the $24.0 midline is possible, but trending markets can hug the lower band for a long time. [Bearish]
- CMF (20): 0.151 and rising since Oct 22 (from 0.05 to 0.15), well above +0.05. Buying pressure is building even as price falls. This is a bullish divergence and the main counter-signal to the bearish trend. [Accumulation]
- ADX (14): 24.9 and rising from about 14, just under the 25 threshold. −DI at 38.2 is far above +DI at 15.3, so sellers control a strengthening downtrend. [Strong Trend + Bearish]
- Volume: 14.95M, below average on the latest bars after a high-volume breakdown candle around Oct 21. The recent slide is on fading volume, which suggests selling exhaustion is possible but no capitulation spike has occurred. [Neutral to mildly Bearish]
DIVERGENCES & TRENDS
- CMF vs price: Price is making lower lows while CMF climbs to its highest level since early August. This is a bullish divergence that points to quiet accumulation.
- RSI: RSI is at 28.5, close to its June 25 low (~25) area. It has not yet made a higher low against a lower price low, so no confirmed RSI divergence.
- Moving average structure: Price is below the EMA21, EMA55, SMA50D ($24.68), VWAP ($26.32) and SMA200D ($27.99). The SMA50D is below the SMA200D (death cross already in place), so the long-term trend is down.
- MACD: The bearish crossover is recent and the histogram is expanding negative, confirming downside momentum.
- ADX/DI: ADX is rising toward 25 with −DI dominant. The downtrend is gaining strength rather than fading.
- Price vs lows: KWEB is at the lowest level on the chart (~$22.1-22.7), below the late-June low of about $23.0, which was a prior support zone and is now broken.
CHART PATTERNS
- Bearish continuation / channel decline: The chart shows a stepped decline since the Aug high (~$29), with lower highs and lower lows. The structure resembles a descending channel, or a "Descending Triangle" breakdown given the failure of the ~$23.0-23.2 support area. The measured move of the breakdown suggests continuation toward about $21.5-22.0.
- Bullish Falling Wedge (possible): The narrowing lows and fading volume in late October loosely resemble a falling wedge, but the price is still making fresh lows and there has been no breakout. It is not confirmed.
- Resistance cluster: Overhead levels at $23.78 (EMA21), $24.68-24.75 (SMA50D/EMA55) and $25.40 (upper band) limit rallies.
POTENTIAL SCENARIOS
- Scenario 1: Bearish Trend Continuation — The downtrend persists with −DI dominance, a negative MACD and price below all moving averages, with only weak bounces to the EMA21. Trigger: close below $22.10 (the chart's low). Target: $21.00-21.50. Invalidation: daily close above $24.00. (50% probability)
- Scenario 2: Bullish Oversold Bounce — RSI oversold plus the CMF accumulation divergence produce a relief rally toward the Bollinger midline and the cluster of moving averages. Trigger: reclaim of $23.80 (EMA21) on rising volume. Target: $24.60-25.00. Invalidation: close below $22.10. (35% probability)
- Scenario 3: Neutral Basing Range — Price chops between $21.80 and $24.00 as selling exhausts and the oversold condition is worked off. Trigger: low-volume consolidation above $22.10. Target: $22.50-23.50. Invalidation: break of either range boundary. (15% probability)
PRICE TARGETS
- Target Price: $22.10 (34-day horizon, a modest drift lower with the trend, tempered by oversold conditions and the CMF divergence)
- Expected Range: $19.90 to $24.20 (width $4.30, about 18.9% of the current price, consistent with the 30-60 day guidance; the 34-day ATR-based range is far wider than a 2-3 day range)
- Key Levels: Support at $22.10, Resistance at $23.78
OVERALL BIAS
OVERALL BIAS: BEARISH - Price is below every moving average with a death cross in place, a fresh bearish MACD crossover, and −DI (38.2) far above +DI (15.3) with ADX rising. The oversold RSI and the rising CMF argue for bounces, but they are not enough to override the trend.
This is educational analysis and not financial advice.