IWM 34-day bullish forecast — Nov 1, 2026
- Bias: Bullish
- Timeframe: 34 days (made Nov 1, 2026, target date Dec 4, 2026)
- Price at analysis: $279.33
- Price target: $285.00
- Expected range: $264.00 – $302.00
- Result: Pending — graded after the close on Dec 4, 2026
Get a free AI analysis of IWM today
Analysis
TECHNICAL INDICATORS
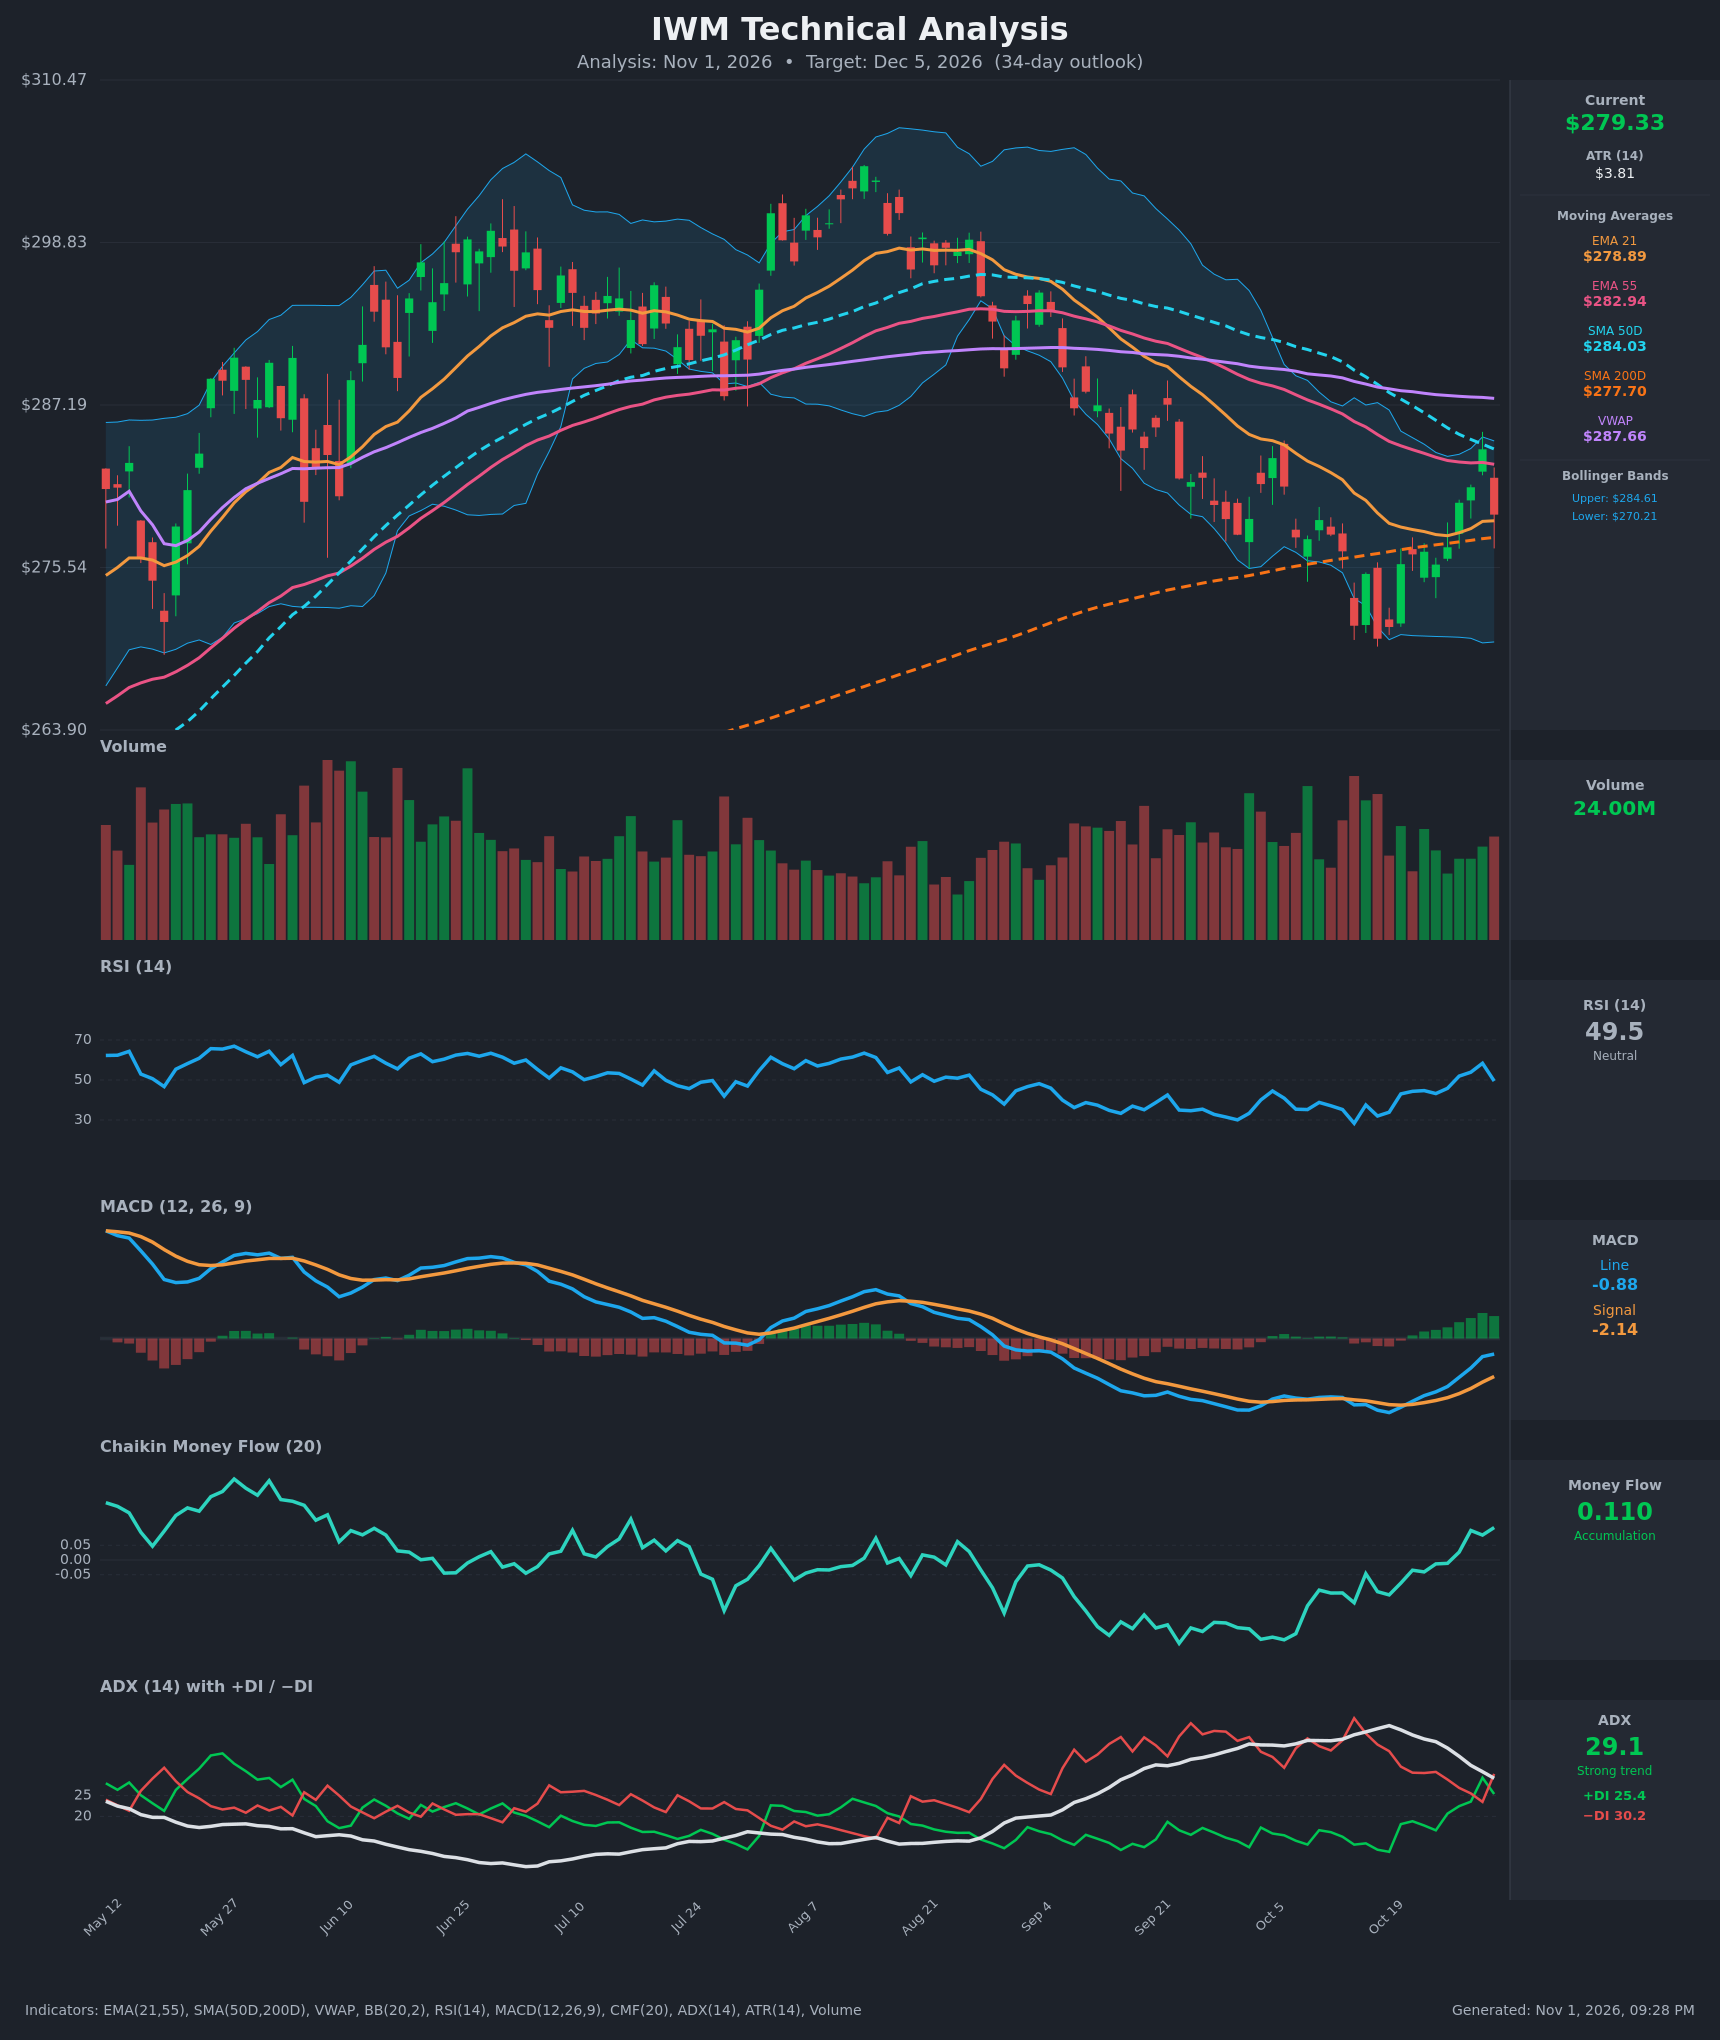
- RSI (14): 49.48, right at the midline. It rose from 28 on Oct 14 to 58 on Oct 29, then dropped about 9 points on the latest down day. It shows no overbought or oversold extreme and has lost some recovery momentum. [Neutral]
- 20 EMA (EMA 21 = $278.89): Price at $279.33 sits just above the EMA21, which is flattening and turning up. The EMA21 is still below the EMA55 ($282.94), so there is no bullish EMA crossover yet. It is a marginal support. [Neutral]
- MACD: The line (-0.875) is above the signal (-2.139), and the histogram is positive and expanding. The bullish crossover happened around Oct 21 while still below zero. Momentum is improving, but the zero line has not been reclaimed. [Bullish]
- Bollinger Bands (20): The bands run $270.21 to $284.61, and price is mid-to-upper band. Oct 29 closed at $284.01, right at the upper band, and the next day reversed. The bands are narrowing from the earlier expansion, which hints at a volatility squeeze. [Neutral]
- CMF (20): 0.110, above the +0.05 threshold. It has risen steadily from -0.145 on Oct 14, so buying pressure is building even while price consolidates. [Accumulation]
- ADX (14): 29.1 and falling from a 41.7 peak, so the downtrend is losing strength. −DI (30.2) is back above +DI (25.4) after Oct 30's decline. The trend is still technically strong, but it is fading and the bears hold a slight edge. [Strong but weakening trend, bearish lean]
- Volume: 24.00M on the last bar, which is average to slightly above average, on a red candle. The Oct bounce came on moderate volume, and the rejection day shows some supply near $284. [Neutral to slightly bearish]
DIVERGENCES & TRENDS
- Price made a marginal low at about $270.4 on Oct 16 while RSI (32) and MACD (-4.0) were already improving compared with Oct 14. That is a mild bullish divergence, and momentum has since turned up.
- CMF has moved from distribution to accumulation, which is a bullish divergence against a price that is still below the 50-day and VWAP.
- MACD crossed above its signal (Oct 21). ADX is rolling over from its peak, which means the Aug–Oct downtrend is maturing.
- Price is above the SMA200 ($277.70), so the long-term trend is intact. It is below the SMA50 ($284.03), EMA55 ($282.94) and VWAP ($287.66), so those act as stacked overhead resistance.
- The SMA50 is above the SMA200 and the gap is narrowing. This is not a death cross yet, but it is a risk if the weakness resumes.
- The Oct 30 candle was a sharp rejection at the SMA50/EMA55 zone.
CHART PATTERNS
- Bullish Double Bottom (developing): The lows at about $270.4 to $271.4 (Oct 14–19) form two troughs. The neckline is about $284 to $285, which is the Oct 29 high and the SMA50 zone. A close above the neckline would project a measured move of roughly 14 points to about $298, but it is not confirmed yet.
- Bearish risk: The sequence of lower highs since Aug, along with the Oct 30 rejection, could form a lower-high consolidation (a bearish pennant or flag shape) under $284. A break below $277.70 and then $270 would negate the double bottom.
- Overall, price is in a base-building structure between $270 and $285 with a slight upward bias.
POTENTIAL SCENARIOS
- Scenario 1: Bullish Double Bottom Breakout — Accumulation (CMF) and the MACD crossover carry price through the $284 to $285 SMA50/neckline cluster. Trigger: daily close above $285 on rising volume. Target: $290 to $298. Invalidation: close below $277.70 (SMA200) and the EMA21. (45% probability)
- Scenario 2: Bearish Rejection and Retest of Lows — The failure at the SMA50/EMA55 and the −DI lead drag price back to the lower band. Trigger: close below $277.70 with the MACD histogram turning down. Target: $270 to $266. Invalidation: close above $285. (35% probability)
- Scenario 3: Neutral Range Chop — Price oscillates between $272 and $285 as ADX falls below 25 and the Bollinger Bands tighten. Trigger: repeated failures at both $285 and $275 with ADX under 25. Target: $278 to $282. Invalidation: decisive close outside the $270 to $286 range. (20% probability)
PRICE TARGETS
- Target Price: $285.00 (34-day, Dec 5, 2026)
- Expected Range: $264.00 to $302.00 (width $38, about 13.6% of current price, consistent with the 30–60 day guidance)
- Key Levels: Support at $277.70 (SMA200; the $270.21 lower band and Oct lows sit below), Resistance at $284.03 (SMA50, with the upper band at $284.61 just above)
OVERALL BIAS
OVERALL BIAS: BULLISH - Bullish MACD crossover, CMF accumulation (0.110), price holding above the SMA200 with a developing double bottom near $270, and a fading ADX all favor a modest upside drift toward $285 over 34 days. The Oct 30 rejection at the $284 resistance and the −DI lead keep conviction modest.
This is educational analysis and not financial advice.