BB 34-day bearish forecast — Nov 1, 2026
- Bias: Bearish
- Timeframe: 34 days (made Nov 1, 2026, target date Dec 4, 2026)
- Price at analysis: $8.42
- Price target: $8.15
- Expected range: $7.55 – $8.85
- Result: Pending — graded after the close on Dec 4, 2026
Get a free AI analysis of BB today
Analysis
TECHNICAL INDICATORS
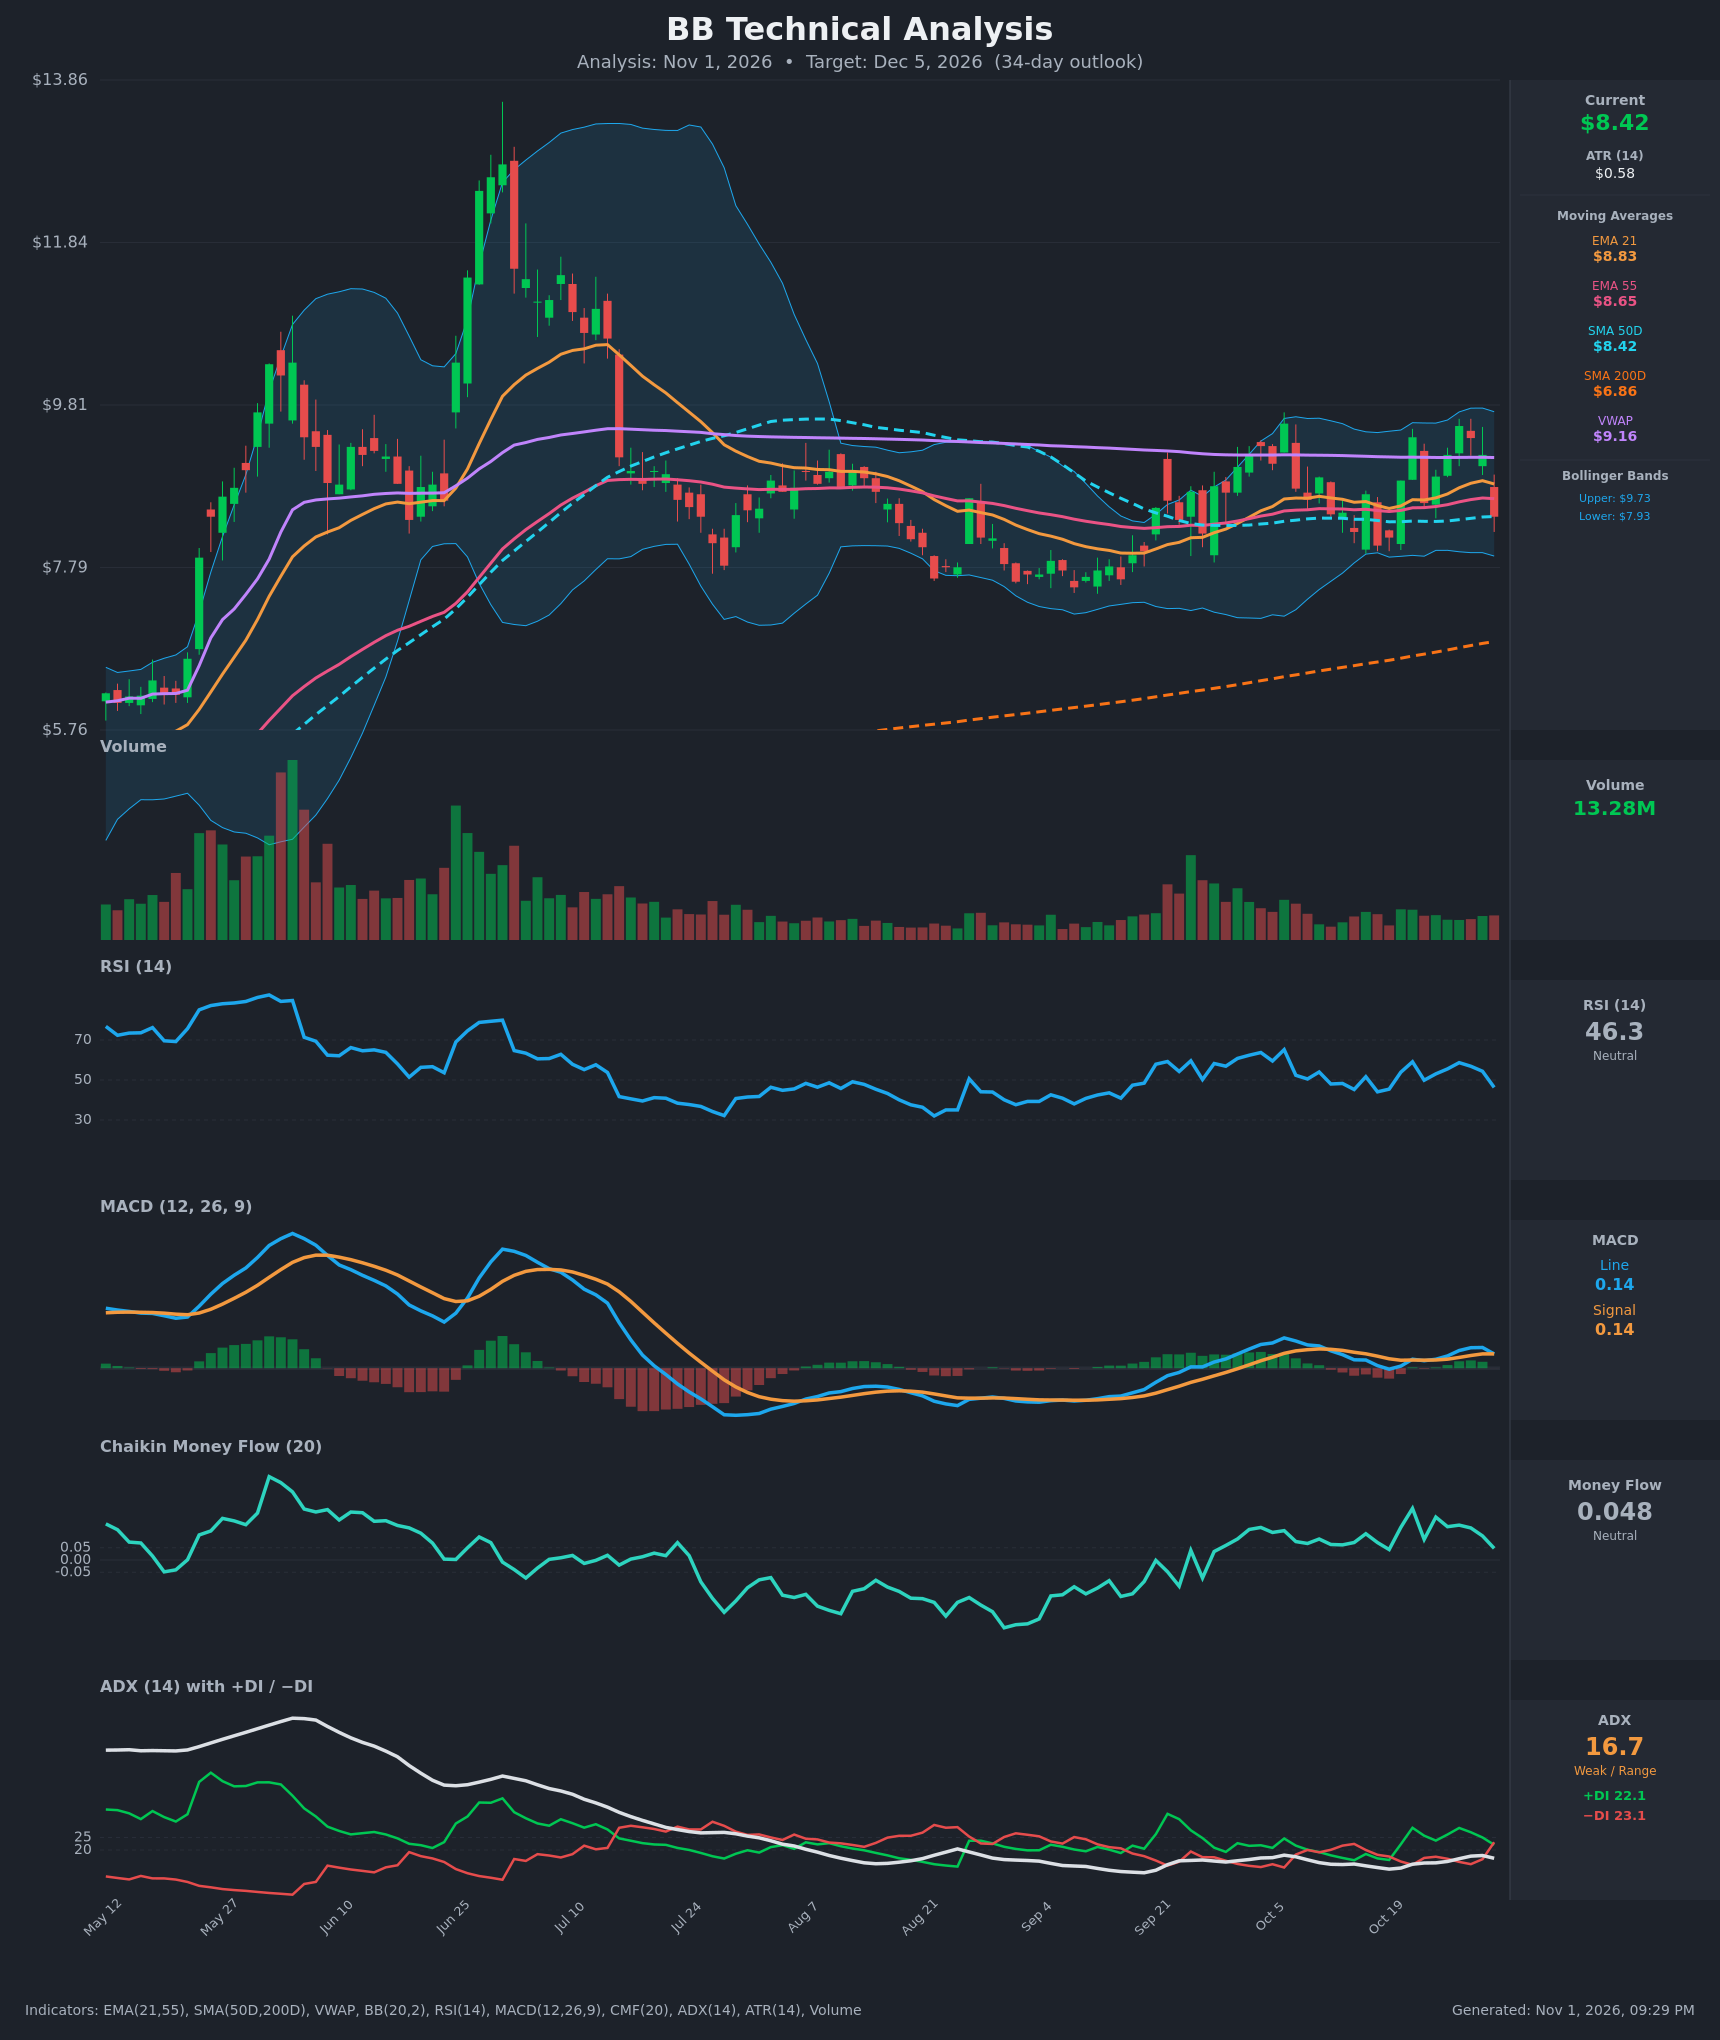
- RSI (14): 46.29, down sharply from 59.1 on Oct 21 and 54.4 on Oct 29. It sits just below the 50 midline, so momentum is fading but not oversold. [Bearish]
- 20 EMA (EMA 21: $8.83): Price at $8.42 closed below the EMA 21 after a failed push above it. It is also below the EMA 55 ($8.65), and the EMA 21 is now acting as resistance. [Bearish]
- MACD: Line 0.1369 vs signal 0.1373, a fresh bearish crossover after peaking near 0.199 on Oct 29. The histogram has flipped to zero or slightly negative after the earlier positive run, and the signal line is flat. [Bearish]
- Bollinger Bands (20): Upper $9.73, lower $7.93, so price is in the lower half of the bands with the midline near $8.83. The bands are fairly narrow, consistent with the range-bound action since August. Price was rejected from the upper band area on Oct 27 ($9.55). [Neutral]
- CMF (20): 0.048, just under the +0.05 accumulation threshold and falling from 0.21 on Oct 21. Buying pressure is fading and the reading is neutral. [Neutral]
- ADX (14): 16.7 (below 20, weak or range-bound), with −DI 23.1 above +DI 22.1. The DI lines just crossed bearishly, but the trend strength is minimal. [Weak Trend, slight bearish tilt]
- Volume: 13.28M, in line with the quiet averages of recent months. The −8.4% drop on Oct 30 had no spike in volume, so selling conviction is moderate. Volume is well below the June–July highs. [Neutral]
DIVERGENCES & TRENDS
- No major divergence. Price made a higher high on Oct 27 ($9.55) while RSI peaked near 59, and the MACD peak on Oct 29 lagged price, so momentum was not exceptional.
- RSI, MACD and CMF are all rolling over together from their Oct 21–29 highs, which confirms the pullback.
- The MACD bearish crossover and the −DI/+DI crossover both occurred on Oct 30.
- Price lost the EMA 21 and EMA 55 in one session and now sits exactly on the SMA 50D ($8.42), the last nearby support.
- Price remains well above the rising SMA 200D ($6.86), and the SMA 50D is above the SMA 200D, so the long-term uptrend structure is intact. The golden cross is long past.
- VWAP ($9.16) is well above price, a sign of overhead supply.
- ADX has been below 20 for months, meaning price is range-bound at about $7.55–$9.85.
CHART PATTERNS
- Bearish Double Top (minor): Peaks at $9.41 (Oct 21) and $9.55 (Oct 27) with a neckline around $8.59. The Oct 30 close at $8.42 broke that neckline. The measured move is about $0.95 ($9.50 − $8.59), pointing to roughly $7.65. A close back above $8.83 would cast doubt on this.
- Broad rectangle or consolidation: Since August, price has oscillated between about $7.55 and $9.85, with a weak ADX. This caps conviction, since the pattern target at $7.65 sits near the bottom of the range, where buyers have stepped in repeatedly.
- The drop from the June peak ($13+) is a large reversal, now in a base or range phase above the SMA 200D.
POTENTIAL SCENARIOS
- Scenario 1: Bearish Double-Top Breakdown Toward Range Support — The neckline break, MACD cross and −DI dominance lead to a drift toward the lower Bollinger Band and the SMA 50D loss. Trigger: Daily close below $8.30 (under the SMA 50D). Target: $7.93, then $7.65–$7.70 (measured move). Invalidation: Daily close above $8.83 (EMA 21). (45% probability)
- Scenario 2: Neutral Range Chop — Weak ADX keeps price oscillating around the SMA 50D and EMA 55 between $8.00 and $8.90. Trigger: Holds $8.20–$8.40 with low-volume candles. Target: $8.20–$8.70. Invalidation: Close below $7.90 or above $9.10. (33% probability)
- Scenario 3: Bullish Reclaim of Moving Averages — The Oct 30 drop proves a false breakdown, and price recovers the EMAs on rising CMF. Trigger: Close above $8.83 with volume. Target: $9.20 (VWAP), then $9.55–$9.73. Invalidation: Close below $8.20. (22% probability)
PRICE TARGETS
- Target Price: $8.15 (34-day)
- Expected Range: $7.55 to $8.85 (width $1.30, about 15.4% of the current price, in line with the 30–60 day guidance)
- Key Levels: Support at $7.93 (lower Bollinger Band), Resistance at $8.83 (EMA 21)
OVERALL BIAS
OVERALL BIAS: BEARISH - Price broke the minor double-top neckline and fell below the EMA 21, EMA 55 and VWAP. MACD and the DI lines both crossed bearishly while RSI and CMF are fading. The weak ADX and the long-term support from the SMA 200D limit the downside to the lower end of the multi-month range.
This is educational analysis and not financial advice.