BAC 34-day bullish forecast — Nov 1, 2026
- Bias: Bullish
- Timeframe: 34 days (made Nov 1, 2026, target date Dec 4, 2026)
- Price at analysis: $50.01
- Price target: $51.80
- Expected range: $46.50 – $54.50
- Result: Pending — graded after the close on Dec 4, 2026
Get a free AI analysis of BAC today
Analysis
TECHNICAL INDICATORS
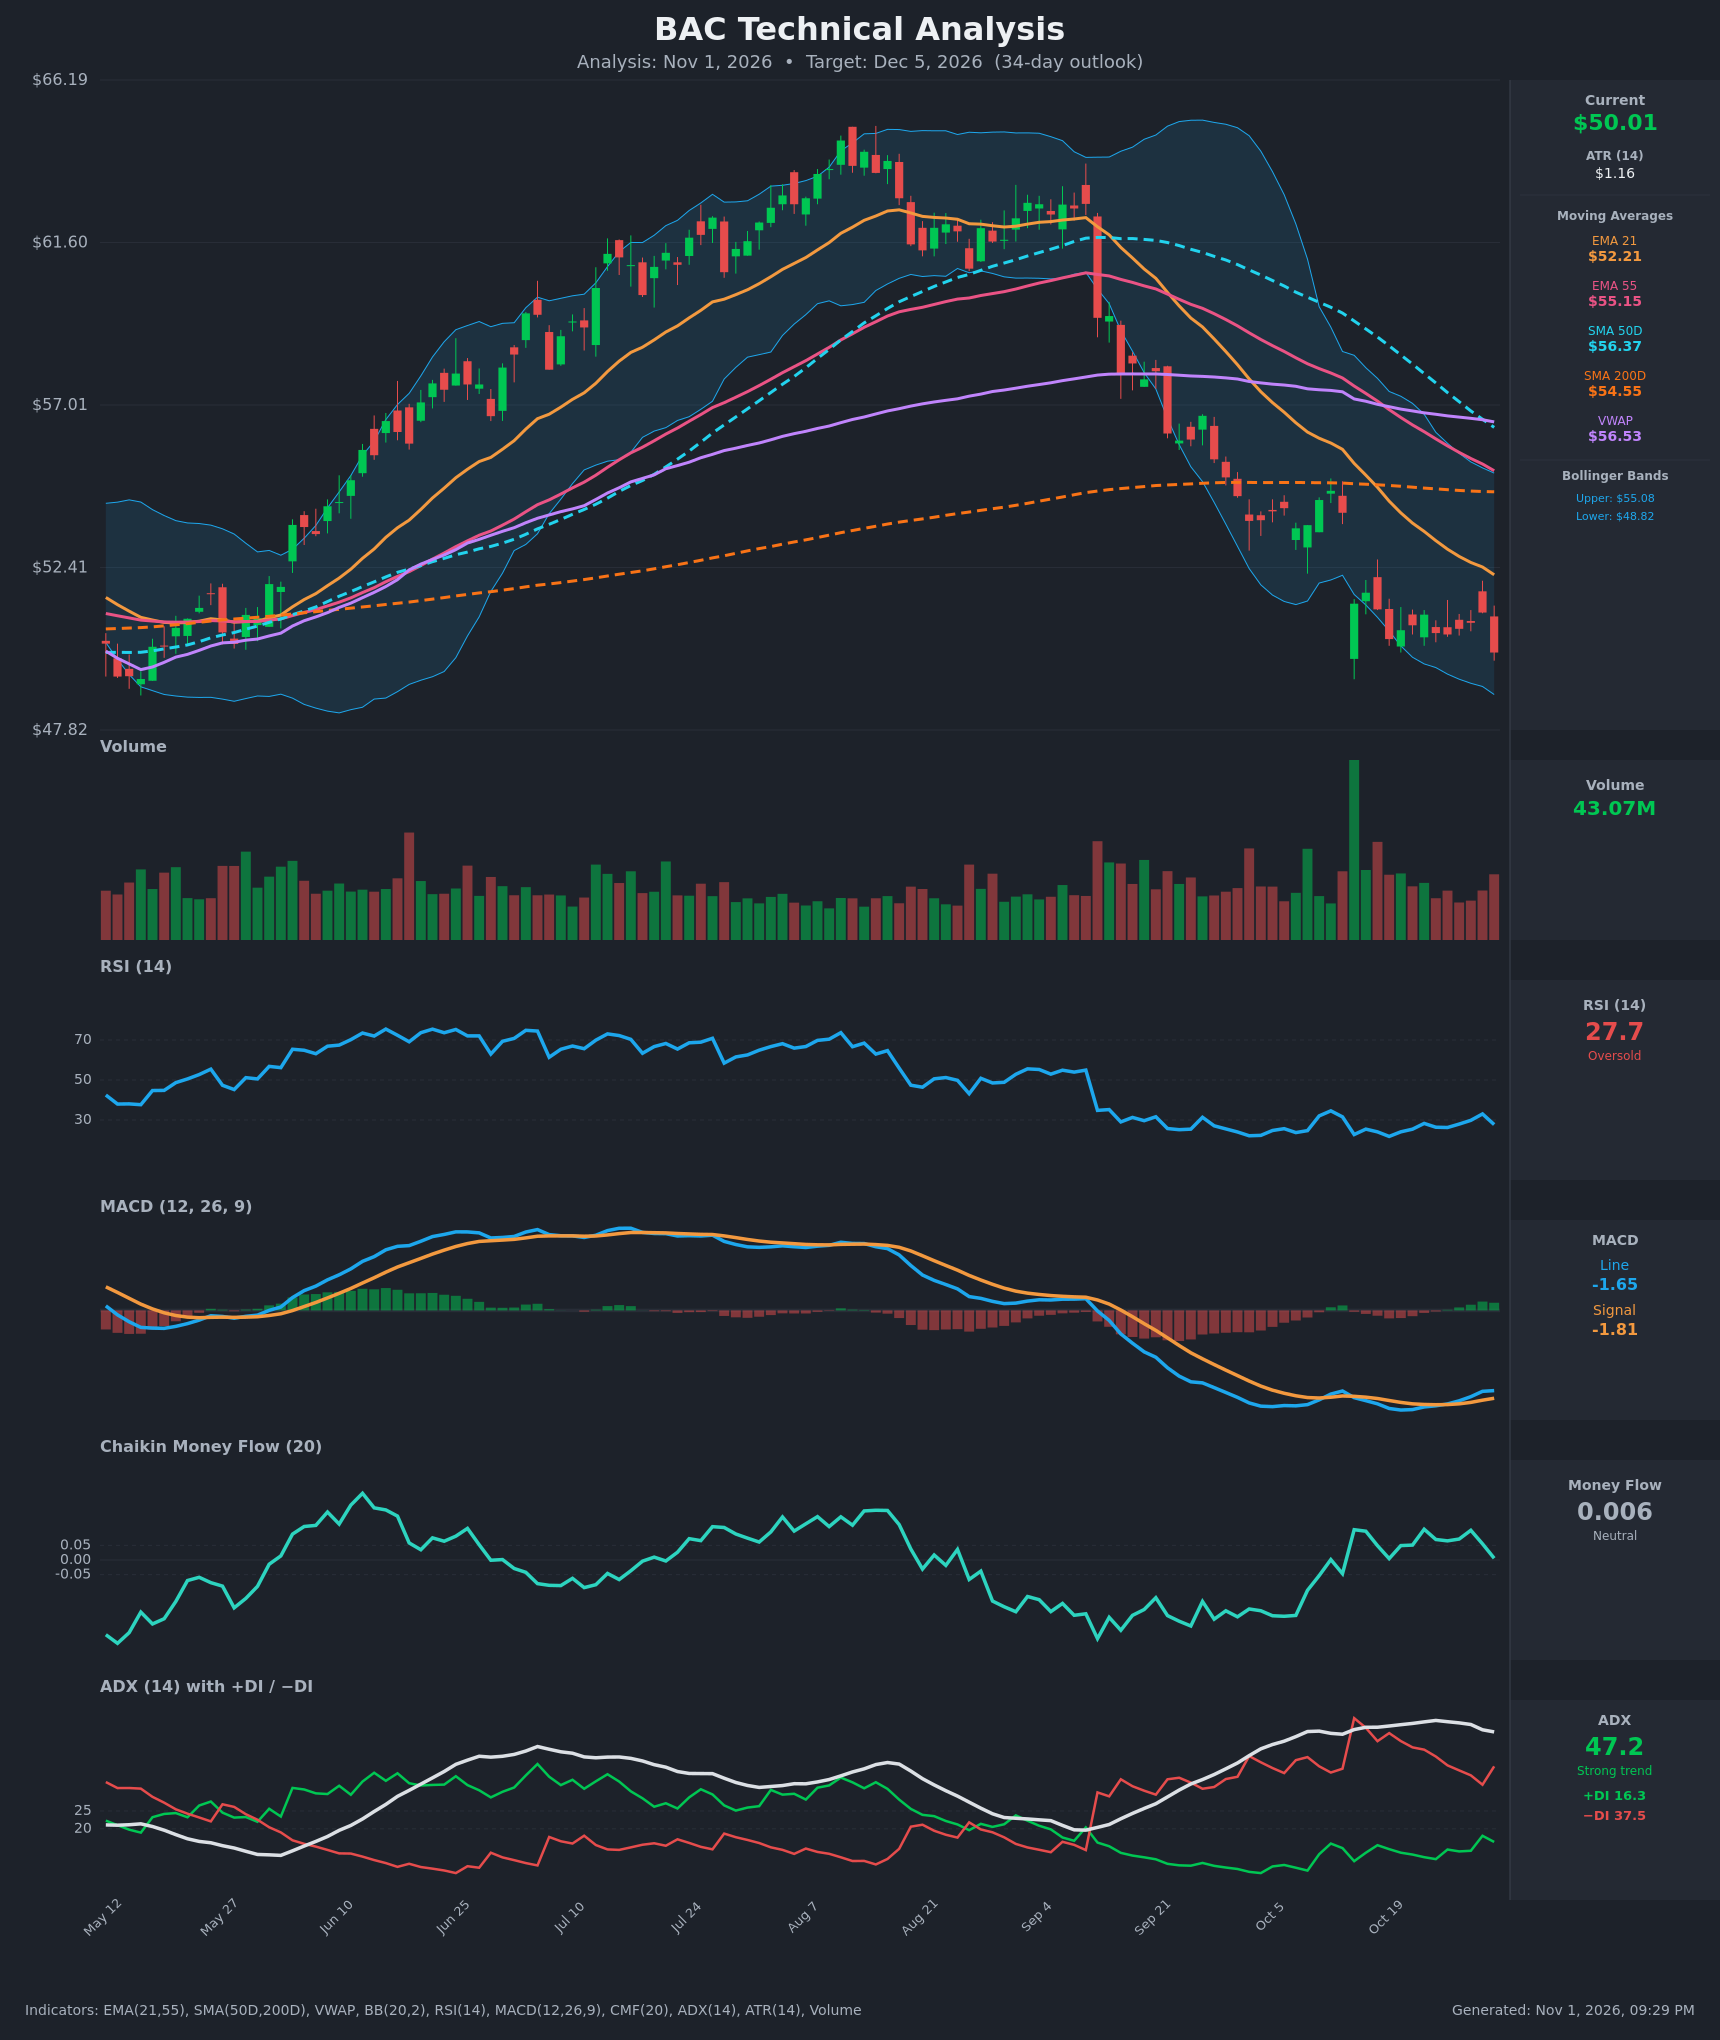
- RSI (14): 27.73, back in oversold territory after a bounce to 33 on Oct 29. The Oct 19 low of 21.8 came at a higher price than today's close, so the current price low is not matched by an RSI low. This is an early bullish divergence, but RSI is still below 30 and has not yet turned up. [Neutral]
- 20 EMA: The 21 EMA is $52.21 and price is $50.01, about 4% below it. The EMA is falling steadily (55.93 to 52.21 in 15 bars), so it acts as overhead resistance. The EMA21 is also far below the EMA55 ($55.15), which confirms a bearish stack. [Bearish]
- MACD: Line -1.649 is above Signal -1.807, a mild bullish crossover that occurred around Oct 26. The histogram is slightly positive and rising. Both lines are deeply negative, and the line is higher than its Oct 20 low of -2.05 even though price is lower. This is a momentum improvement, not a trend reversal. [Bullish]
- Bollinger Bands (20): Upper $55.08, lower $48.82, with price in the lower quarter of the band, about $1.20 above the lower band. The bands are widening and sloping down after the Sept-Oct selloff. The price is walking the lower half of the bands, which signals a persistent downtrend, though it is stretched. [Bearish]
- CMF (20): 0.006, within the ±0.05 neutral zone. It has faded from about 0.10 over the last two weeks, so buying pressure is not supporting the bounce attempts. There is no accumulation signal. [Neutral]
- ADX (14): 47.2, a very strong trend, with −DI (37.5) far above +DI (16.3). Bears are firmly in control. ADX above 45 is also an extreme reading that often precedes trend exhaustion or a pause, and it has begun to roll over slightly (50.4 to 47.2). [Strong Trend - Bearish]
- Volume: 43.07M on the latest red candle, which closed at a new low of $50.01. This is a volume-supported breakdown from the 2-week range. The earlier capitulation spike around Oct 14 produced only a brief bounce. [Bearish]
DIVERGENCES & TRENDS
- Bullish divergence (RSI/MACD): Price made a lower close ($50.01 vs $50.39 on Oct 19) while MACD (-1.65 vs -2.02) and RSI (27.7 vs 21.8) made higher lows. Downside momentum is fading, but the divergence is modest and unconfirmed.
- Moving-average structure: Price is below the EMA21, EMA55, SMA50D ($56.37), SMA200D ($54.55) and VWAP ($56.53), so the trend is bearish on every timeframe. The EMA21 crossed below the EMA55 in September. The SMA50D is falling toward the SMA200D (a gap of about $1.82 that is closing by about $0.25 a day), so a death cross is likely within the next 1-2 weeks.
- DI and ADX: −DI has been above +DI since early September. Neither +DI nor ADX has signaled a trend change.
- Range break: After the Oct 14 flush, price consolidated between roughly $50.4 and $51.7. The Oct 30 close of $50.01 broke below that base on heavy volume.
- MACD vs. signal: The line is above the signal and the histogram is positive, which is the one clear improving trend. A fall back below the signal would negate it.
CHART PATTERNS
- Bearish Pennant / Flag (continuation): The tight range after the sharp Oct 14 drop resembles a bearish pennant or rectangle. The downside break on Oct 30 is consistent with that pattern. The measured move from the ~$3 pole projects to roughly $47-48, close to the chart low at $47.82 and just below the lower Bollinger Band.
- Bullish Falling Wedge (reversal, lower probability): The sequence of lower highs and slightly higher momentum lows loosely resembles a falling wedge. It would only be valid on a close back above about $51.7, with a target of the EMA21 near $52.2 and then $53.5-54.5 (SMA200D).
- Macro structure: The decline from about $64 to $50 is a Double Top / Head and Shoulders style reversal that has already broken down. Long-term trend damage is significant.
POTENTIAL SCENARIOS
- Scenario 1: Bullish Oversold Relief Bounce — RSI below 30 with a bullish MACD cross and divergence, price near the lower Bollinger Band, and ADX above 45 (a level that often marks exhaustion) set up a mean-reversion rally toward the falling EMA21. Trigger: daily close back above $51.70 (top of the recent range), then above $52.21. Target: $52.20-$53.50, with $51.80 as the central estimate. Invalidation: daily close below $48.80 (lower Bollinger Band) on strong volume. (45% probability)
- Scenario 2: Bearish Trend Continuation — The range breakdown on heavy volume, −DI dominance, a looming death cross and a negative MA stack project a measured-move drop toward the prior low. Trigger: a close below $49.50 followed by a break of $48.82. Target: $47.00-$48.00 and possibly $46.50. Invalidation: close above $52.21 (EMA21). (40% probability)
- Scenario 3: Neutral Basing Range — Price chops between about $48.80 and $52.20 as RSI resets and the ADX decays. Trigger: failure of both breakout levels. Target: $49.50-$51.50. Invalidation: a decisive close outside $48.50-$52.50. (15% probability)
PRICE TARGETS
- Target Price: $51.80 (34-day target)
- Expected Range: $46.50 to $54.50 (width $8.00, about 16% of the current price, which fits the 30-60 day guidance of 12-18%)
- Key Levels: Support at $48.82 (lower Bollinger Band; the $47.82 chart low is below it), Resistance at $52.21 (EMA21, then $54.55 SMA200D)
OVERALL BIAS
OVERALL BIAS: BULLISH - RSI is oversold at 27.7 with a bullish MACD cross and a momentum divergence, and price is hugging the lower Bollinger Band, so a mean-reversion bounce toward the $51.80-$52.20 EMA21 area is the modest-conviction call over 34 days. The conviction is low because the trend is very strong to the downside (ADX 47, −DI dominant, price below all key MAs, an imminent death cross, and a fresh range breakdown), so a close below $48.80 would flip the view.
This is educational analysis and not financial advice.