QCOM 34-day bearish forecast — Nov 1, 2026
- Bias: Bearish
- Timeframe: 34 days (made Nov 1, 2026, target date Dec 4, 2026)
- Price at analysis: $164.79
- Price target: $159.00
- Expected range: $147.00 – $173.00
- Result: Pending — graded after the close on Dec 4, 2026
Get a free AI analysis of QCOM today
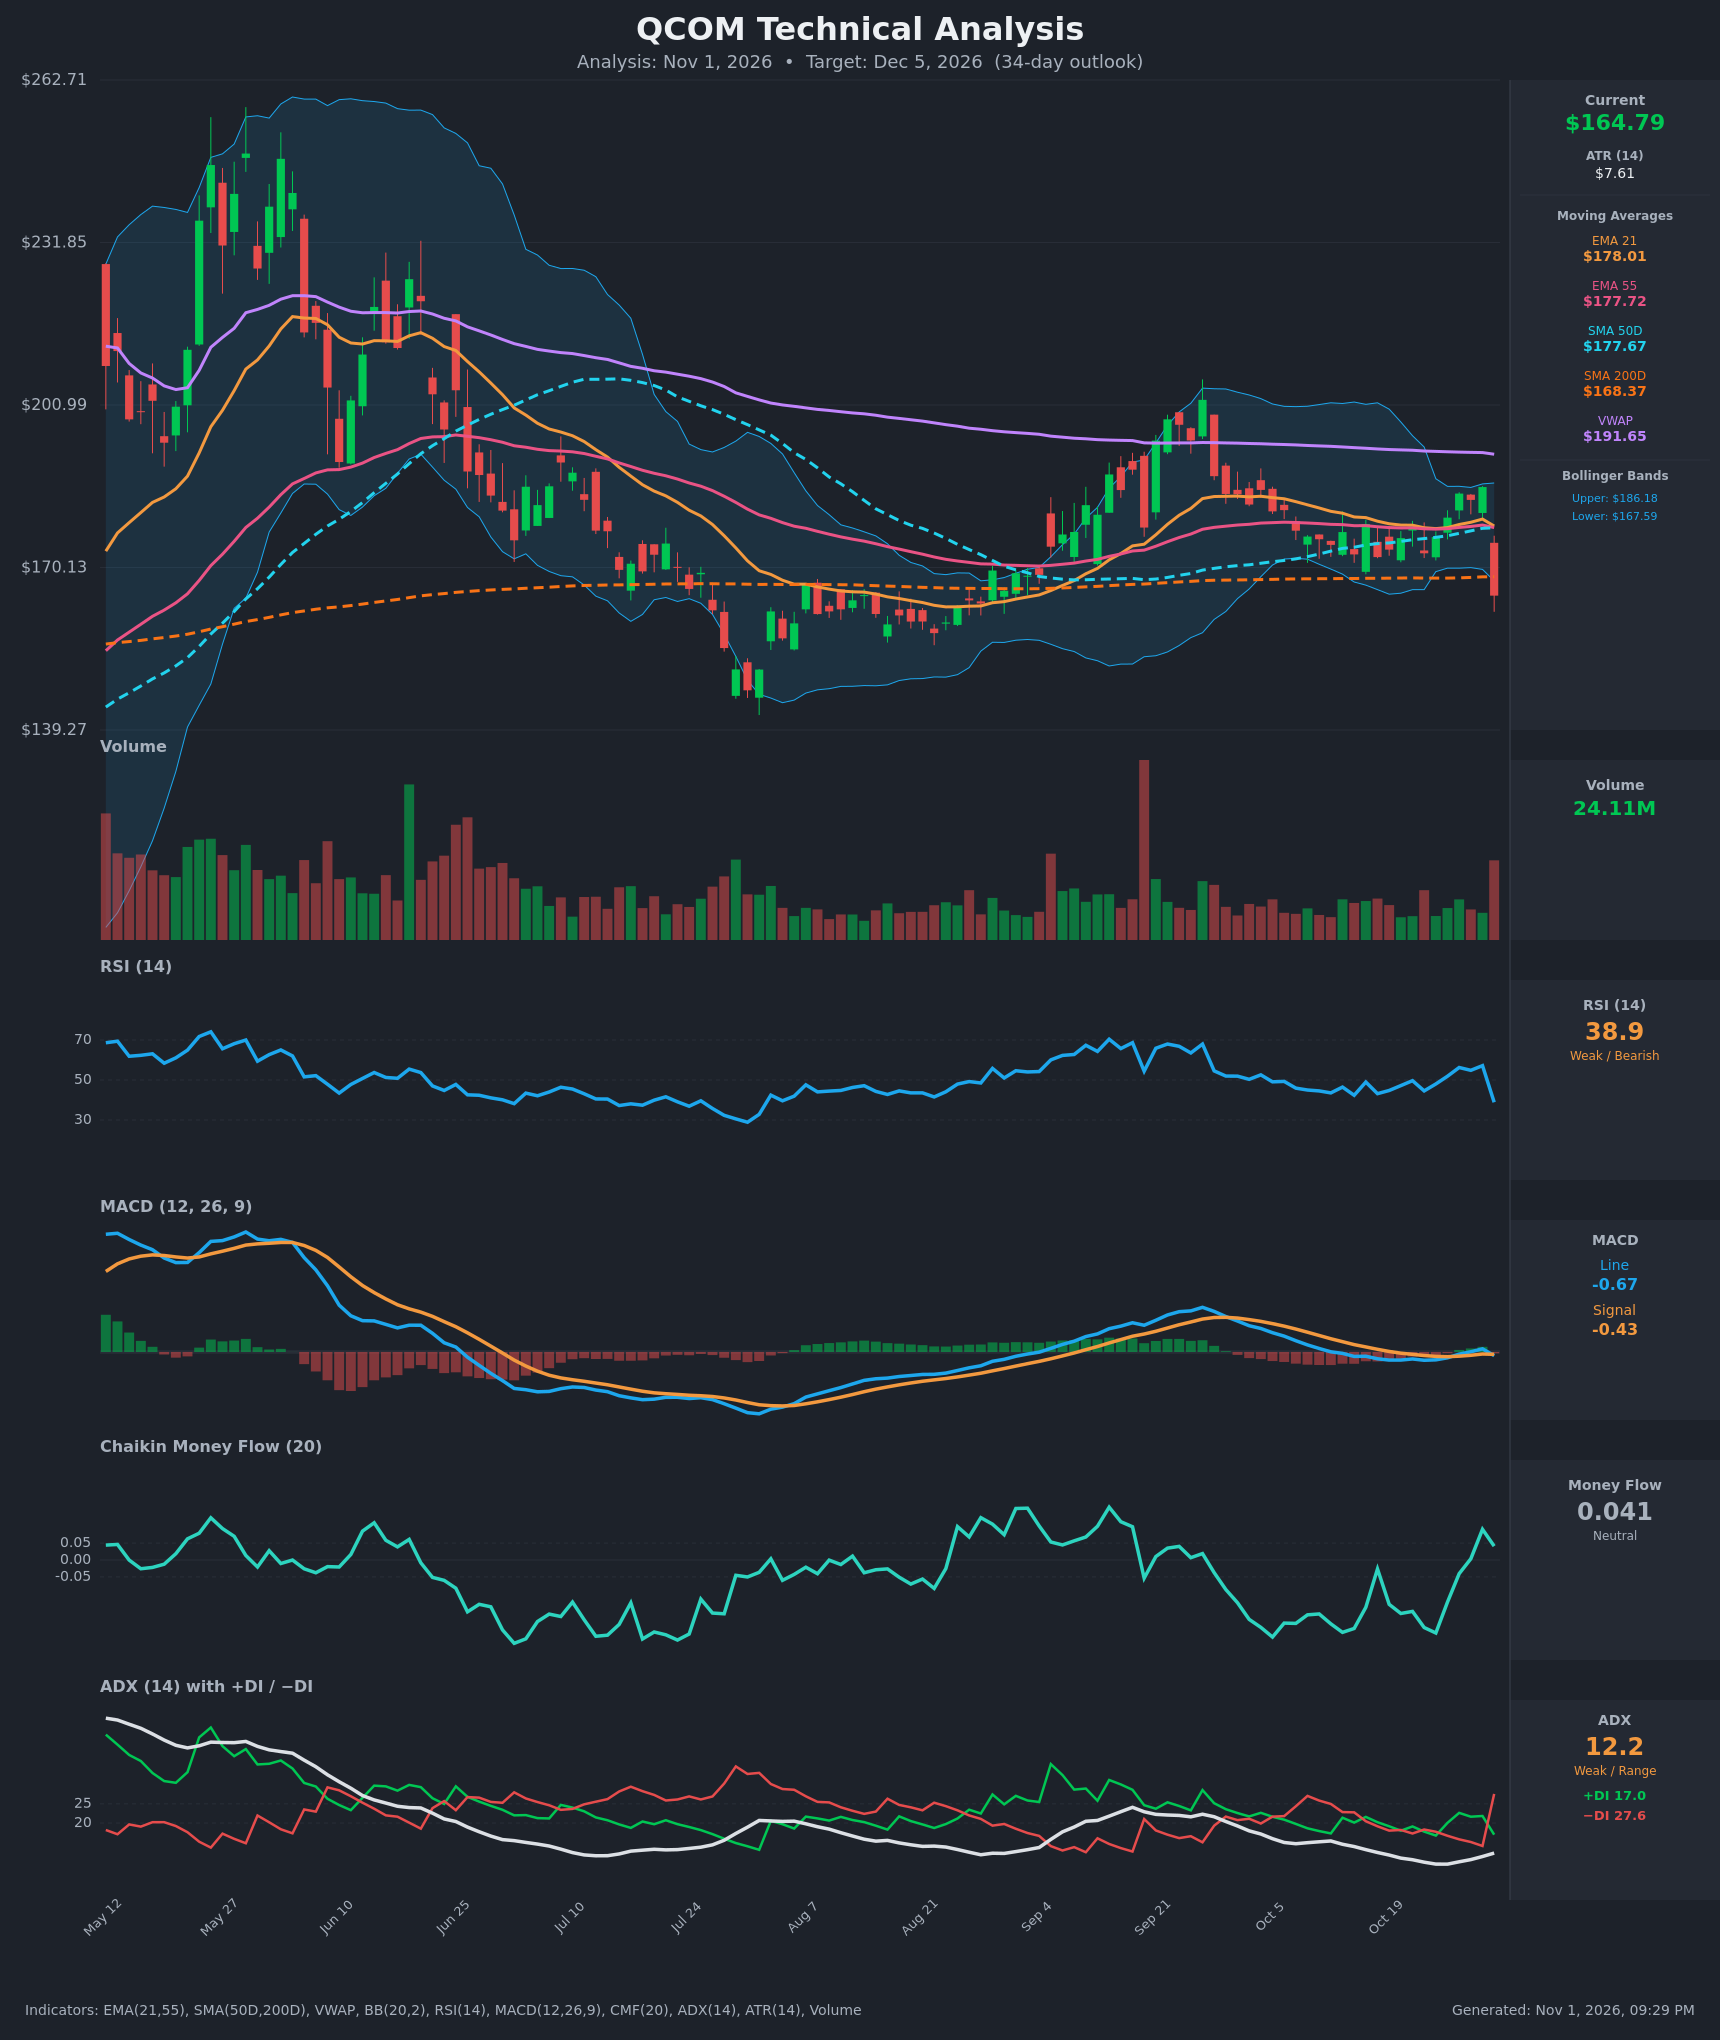
Analysis
TECHNICAL INDICATORS
- RSI (14): 38.86, down sharply from 57.2 one bar earlier. Momentum has turned down and is approaching the oversold zone (30), but it is not there yet. [Bearish]
- 20 EMA: The supplied value is the EMA 21 at $178.01. Price at $164.79 is about 7.4% below it, so the EMA now acts as overhead resistance. EMA21 ($178.01) is also just above EMA55 ($177.72), a flat, tangled structure. [Bearish]
- MACD: Line -0.67 is below signal -0.43, a fresh bearish crossover. It happened on Oct 30 after the line had briefly crossed above the signal. Both lines are hovering around zero, so the histogram is slightly negative and momentum is weak and indecisive. [Bearish]
- Bollinger Bands (20): Upper $186.18, lower $167.59. Price at $164.79 closed below the lower band after a roughly 11% one-day drop (from $185.41). That is a statistically stretched move. The bands are fairly narrow, so this is a volatility expansion. A close below the band can mean either continuation or a snap-back toward the mean. [Bearish]
- CMF (20): 0.041, between -0.05 and +0.05. Buying pressure had been building (from -0.2 to +0.09), but the gap-down on heavy volume has started to reverse it. [Neutral]
- ADX (14): 12.2, which is weak and range-bound, but it has ticked up from 9.3. −DI (27.6) has jumped above +DI (17.0), a bearish DI crossover. That means sellers took control on the drop, but there is no established trend yet. [Weak Trend + Bearish direction]
- Volume: 24.11M on the latest bar, the heaviest of the recent period. It is a high-volume red candle, which points to genuine distribution or a news-driven event, such as earnings. [Bearish]
Moving average context:
- Price is below VWAP ($191.65), which shows sustained selling pressure relative to volume-weighted averages.
- Price is below SMA50D ($177.67) and below SMA200D ($168.37). It is only just below the SMA200D, so that level is the key long-term line being tested.
- SMA50D ($177.67) is above SMA200D ($168.37), so no death cross has formed. The trend structure is mixed.
DIVERGENCES & TRENDS
- No clear divergence between price and RSI. Both fell together on the gap-down.
- RSI fell from 57 to 39 in one session, a sharp loss of momentum that confirms the break lower.
- MACD has just crossed bearish near the zero line. Zero-line crossovers with a flat histogram are less reliable, but the heavy-volume breakdown adds weight.
- The −DI/+DI crossover and the ADX uptick suggest a possible start of a downtrend, although ADX is still below 20.
- Before the drop, price spent about three weeks compressed around the converged EMA21, EMA55 and SMA50D (about $177-178), forming a tight consolidation. That base broke to the downside.
- The rally from the early-August low (~$145) topped near $200 in late September and has been fading since, a lower-high structure.
CHART PATTERNS
- Bearish breakdown from consolidation / rising-wedge-like structure: Price rose from the Aug lows, then drifted sideways under the $185-200 area. The latest bar broke below the converged moving averages and the lower Bollinger Band. This resembles the "Bearish Rising Wedge" and "Bearish Pennant" in the reference diagram. The measured move of the prior consolidation range ($172-$185, about $13) projects to roughly $152-$160 from the breakdown.
- A Descending / Lower-High structure from the Sep high of about $200 toward $185 shows weakening bullish follow-through.
- Key support is the SMA200D at $168.37, which price has just lost on a closing basis. The next support is the Aug-Sep lows around $155-$160, then the Jul-Aug low around $145.
- An important caveat is that the drop was a single large gap bar, and such moves often partially retrace (a dead-cat bounce) toward the $170-$175 gap area before the next leg.
POTENTIAL SCENARIOS
- Scenario 1: Bearish Continuation Toward the Summer Lows — The heavy-volume breakdown through the SMA200D and the lower band is followed by a bounce that stalls near $172-$175. Sellers then press price toward the $155-$160 zone, as −DI stays above +DI and MACD stays negative. Trigger: Daily close below $160 or failure to reclaim $168-$170. Target: $154-$158. Invalidation: Daily close above $178 (the EMA21/55/SMA50D cluster). (50% probability)
- Scenario 2: Neutral Choppy Basing After the Gap — Price stabilizes after the shock, consolidating between $158 and $175 as ADX stays low and RSI recovers from the 30s. Trigger: Several sessions of narrow ranges holding above $160. Target: $160-$172 range. Invalidation: Close outside $155-$178. (20% probability)
- Scenario 3: Bullish Mean-Reversion Rebound — An oversold bounce from the lower Bollinger Band fills part of the gap and retakes the SMA200D and the $175-$178 MA cluster. Trigger: Daily close above $170 with expanding volume and a MACD re-cross. Target: $176-$180. Invalidation: Failure at $175 or close below $160. (30% probability)
PRICE TARGETS
For a 34-day horizon, the range width should be about 12-18% of the current price. I chose a width of about $26 (roughly 15.8%).
- Target Price: $159.00 (34 days)
- Expected Range: $147.00 to $173.00 (width $26.00, about 15.8%)
- Key Levels: Support at $155.00, Resistance at $168.37
OVERALL BIAS
OVERALL BIAS: BEARISH - A heavy-volume gap-down of about 11% broke below the converged EMA/SMA50D cluster, the SMA200D and the lower Bollinger Band. This came with a bearish MACD cross, −DI jumping above +DI, and price well below VWAP. Weak ADX and an oversold-bounce risk keep conviction moderate.
This is educational analysis and not financial advice.