QQQ 34-day bearish forecast — Nov 1, 2026
- Bias: Bearish
- Timeframe: 34 days (made Nov 1, 2026, target date Dec 4, 2026)
- Price at analysis: $690.49
- Price target: $676.00
- Expected range: $632.00 – $722.00
- Result: Pending — graded after the close on Dec 4, 2026
Get a free AI analysis of QQQ today
Analysis
TECHNICAL INDICATORS
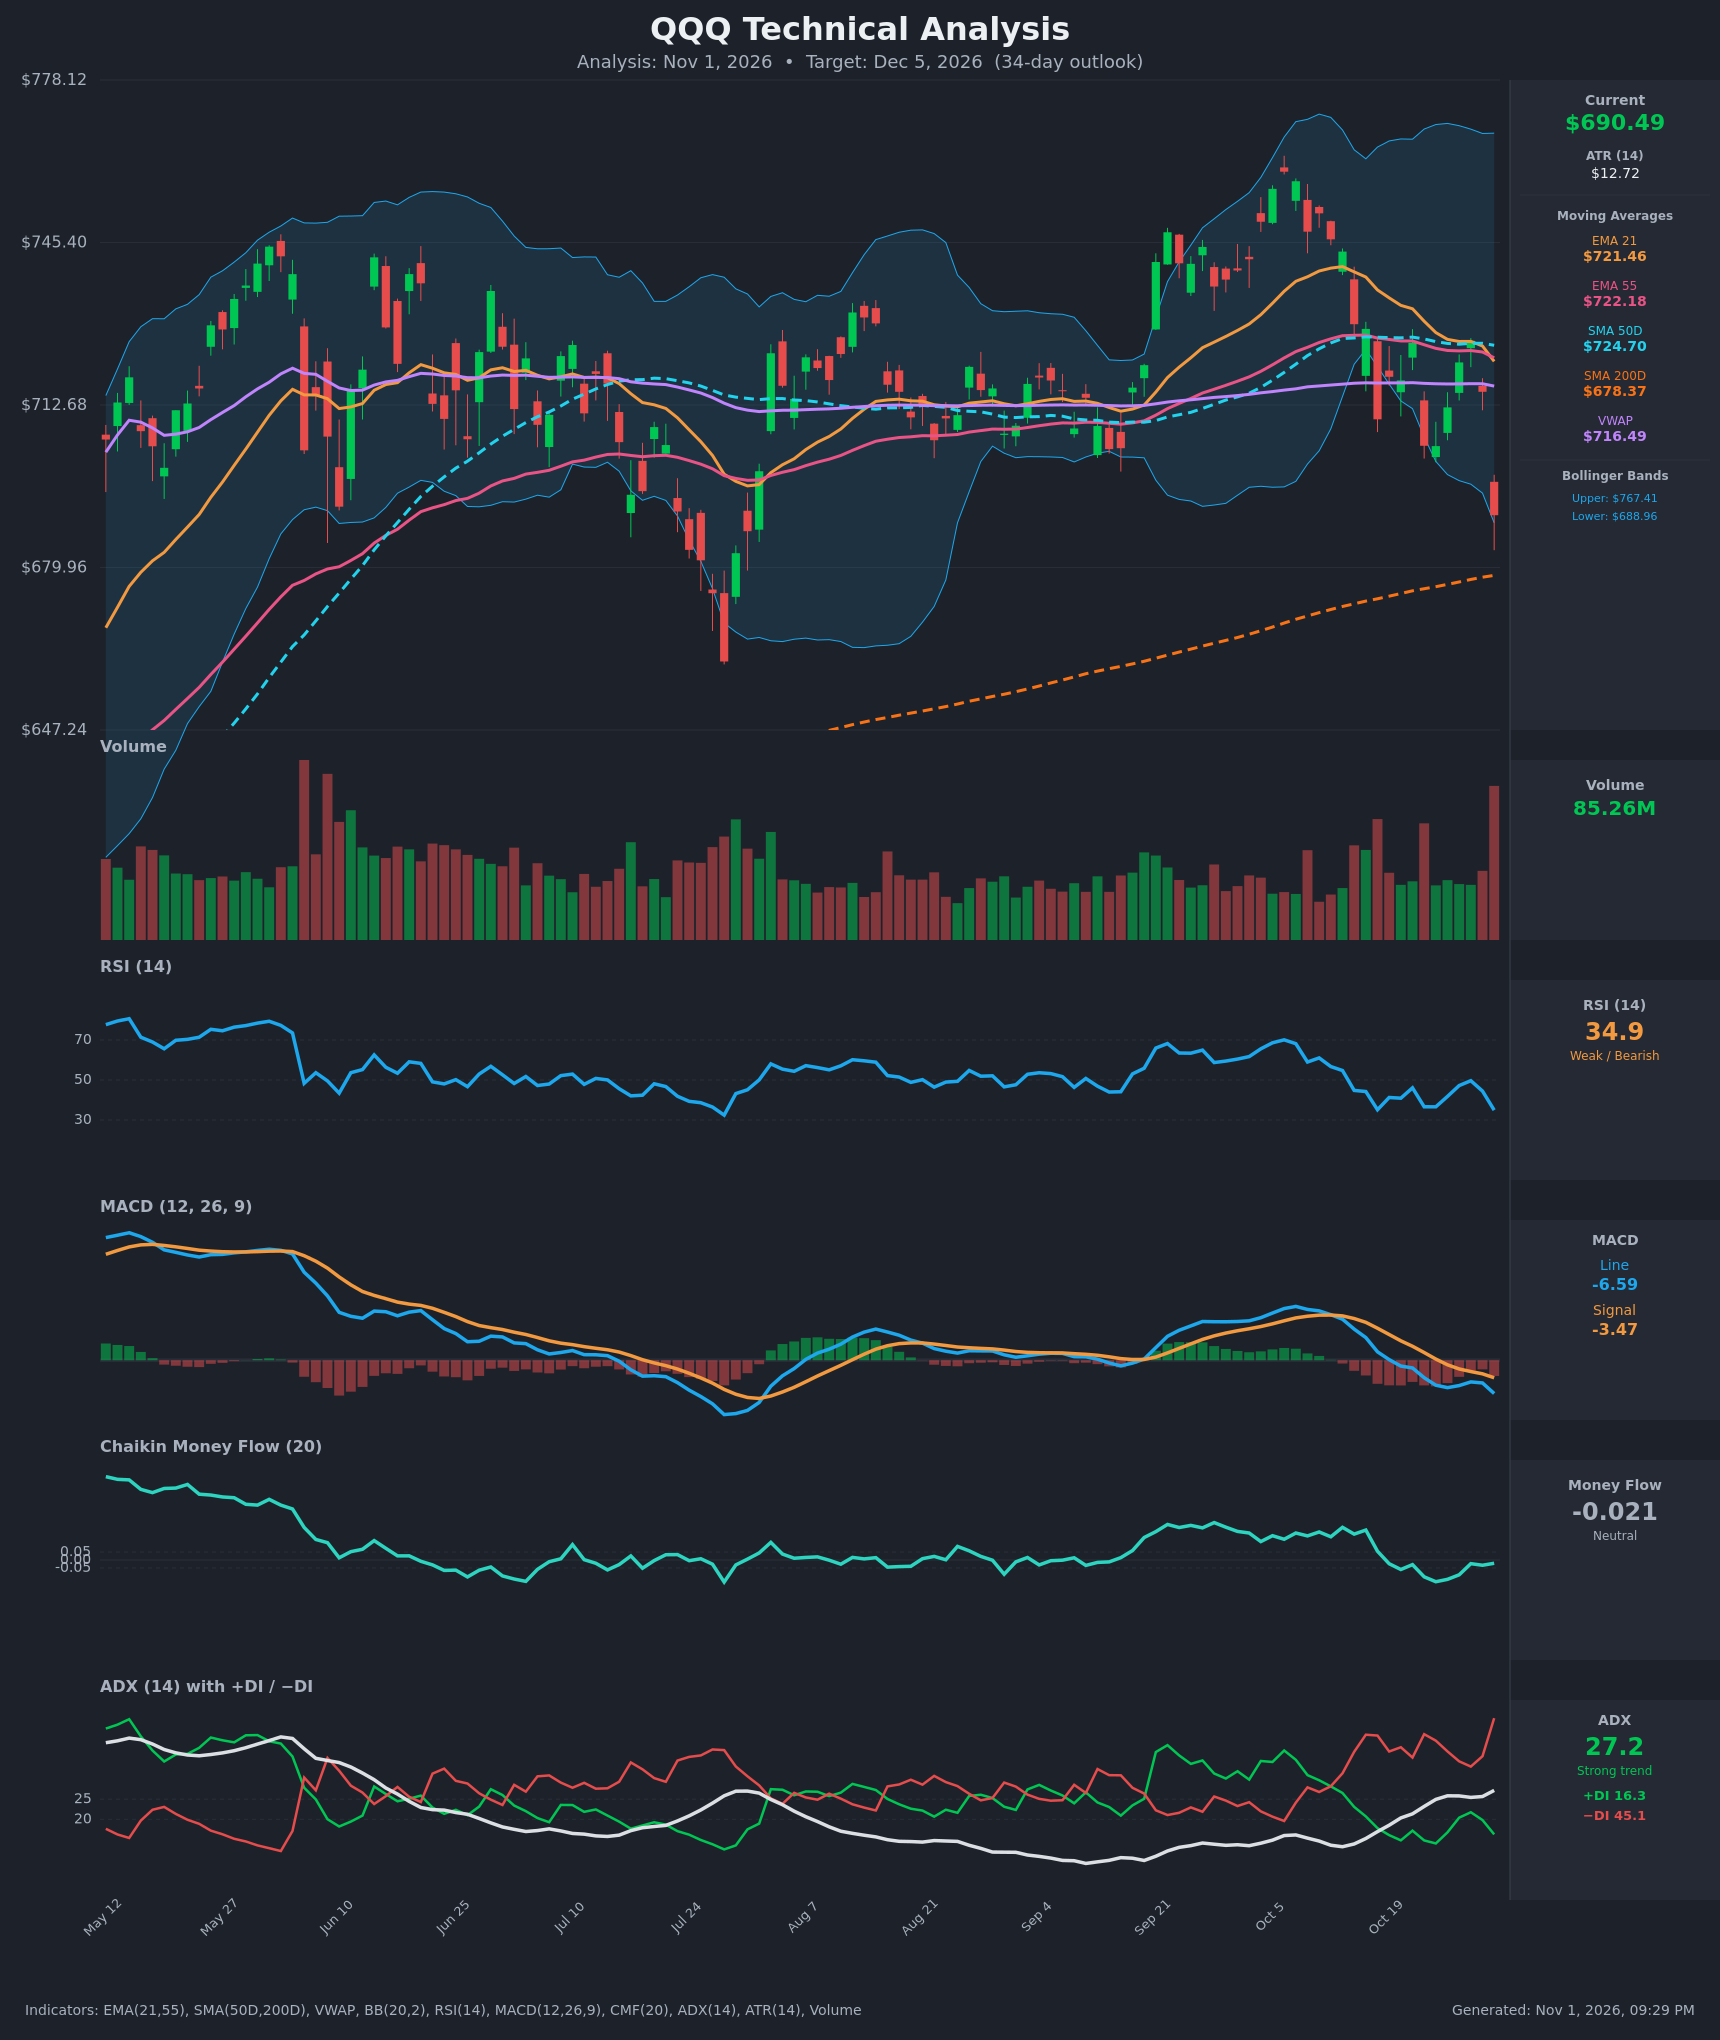
- RSI (14): 34.93, down from 49.6 on Oct 28 and near the 30 oversold line. Momentum is clearly falling, with lower RSI highs since early October (about 70 down to about 49). It is not yet oversold, so there is room to fall further. [Bearish]
- 20 EMA: The 21 EMA is $721.46, and price at $690.49 is about 4.3% below it. The EMA is rolling over and acts as overhead resistance. The EMA21 has also slipped below the EMA55 ($722.18), a fresh bearish crossover. [Bearish]
- MACD: The line is -6.59 and the signal is -3.47. The bearish crossover happened around Oct 19-20, and the histogram is expanding negative (about -3.1). Both lines are below zero and still diverging. [Bearish]
- Bollinger Bands (20): Upper $767.41, lower $688.96. Price at $690.49 sits right on the lower band after a wide-range down day. The bands are wide, which shows elevated volatility. A walk down the lower band is possible in a strong trend, but a snap-back toward the mid-band (about $728) is also common. [Neutral]
- CMF (20): -0.021, between ±0.05, so neutral. It has faded from +0.2 in mid-October to slightly negative, a clear deterioration in buying pressure. [Neutral]
- ADX (14): 27.2 and rising (from 13 on Oct 12). −DI is 45.1, far above +DI at 16.3. This is a strong, accelerating downtrend with bears firmly in control. [Strong Trend – Bearish]
- Volume: 85.26M, the largest bar on the chart, on a large red candle (-3.5%). This is heavy distribution or a breakdown, and it confirms the move below the moving averages. It could also mark short-term capitulation if there is no follow-through. [Bearish]
Other moving averages: price is below VWAP ($716.49), the SMA50D ($724.70) and both EMAs, but still above the SMA200D ($678.37) by about 1.8%. The SMA50D is well above the SMA200D, so there is no death cross, and the long-term trend is intact but being tested.
DIVERGENCES & TRENDS
- There is no bullish divergence yet. RSI is making new lows in step with price, not holding up.
- The RSI in early October peaked near 70 while price made a lower high around Oct 12 versus the early-October peak. This is a mild bearish divergence that has already played out.
- MACD has crossed bearishly and is still widening. The EMA21/EMA55 bearish cross and the price break below all short-term MAs add to the weight.
- ADX has risen from 13 to 27 while −DI has pushed from 28 to 45, a classic emerging downtrend.
- CMF has slid from +0.2 to about -0.02, showing money flow rolling over.
- The SMA200D is the key long-term support. The July low near $660 is the next major structural floor.
CHART PATTERNS
- Bearish Double Top (reversal): Peaks at roughly $760-765 in early October and about $746 on Oct 12 form an approximate double top. The neckline near $704-705 (the Oct 22-23 lows) has been broken. The measured move (about $56 of height) points to roughly $648-650, near the July low area.
- Range breakdown: Price is leaving the roughly $690-$745 range of the past several months through its bottom. The breakdown comes on the highest volume in months.
- Caveat: Price sits just above the SMA200D ($678) and the lower Bollinger Band, so a relief bounce toward the $716-$722 resistance cluster (VWAP/EMA21/EMA55) is plausible before any further leg down.
POTENTIAL SCENARIOS
- Scenario 1: Bearish Breakdown Continuation — The double-top breakdown extends, with the SMA200D at about $678 breaking and ADX/−DI staying elevated. Trigger: daily close below $678. Target: $650-$660 (July low and measured move). Invalidation: daily close back above $722 (EMA21/EMA55 cluster). (50% probability)
- Scenario 2: Bullish Oversold Bounce — RSI near 30, the lower Bollinger Band and the SMA200D attract buyers, and price mean-reverts toward VWAP and the EMAs. Trigger: reclaim of $705 on a closing basis with improving volume. Target: $716-$725. Invalidation: close below $675. (33% probability)
- Scenario 3: Neutral Choppy Base — Price consolidates between the SMA200D and the $705-$715 area while the indicators reset. Trigger: several closes between $678 and $712. Target: $685-$700. Invalidation: a close outside $672-$722. (17% probability)
PRICE TARGETS
For the 34-day horizon (to about Dec 5, 2026):
- Target Price: $676.00
- Expected Range: $632.00 to $722.00 (width $90, about 13% of the current price, consistent with the 30-60 day guidance)
- Key Levels: Support at $678.37 (SMA200D), then $660 (July low). Resistance at $716.49 (VWAP), then $721.46 (EMA21).
OVERALL BIAS
OVERALL BIAS: BEARISH - The double-top neckline break on the heaviest volume in months, a bearish MACD crossover, a rising ADX (27.2) with −DI (45.1) far above +DI (16.3), and price below all short-term moving averages favor further downside toward the SMA200D and the July low. Oversold conditions at the lower Bollinger Band mean bounces to $716-$722 are likely along the way, and a close back above $722 would invalidate the call.
This is educational analysis and not financial advice.