SMCI 34-day bearish forecast — Nov 1, 2026
- Bias: Bearish
- Timeframe: 34 days (made Nov 1, 2026, target date Dec 4, 2026)
- Price at analysis: $32.95
- Price target: $31.00
- Expected range: $26.50 – $37.00
- Result: Pending — graded after the close on Dec 4, 2026
Get a free AI analysis of SMCI today
Analysis
TECHNICAL INDICATORS
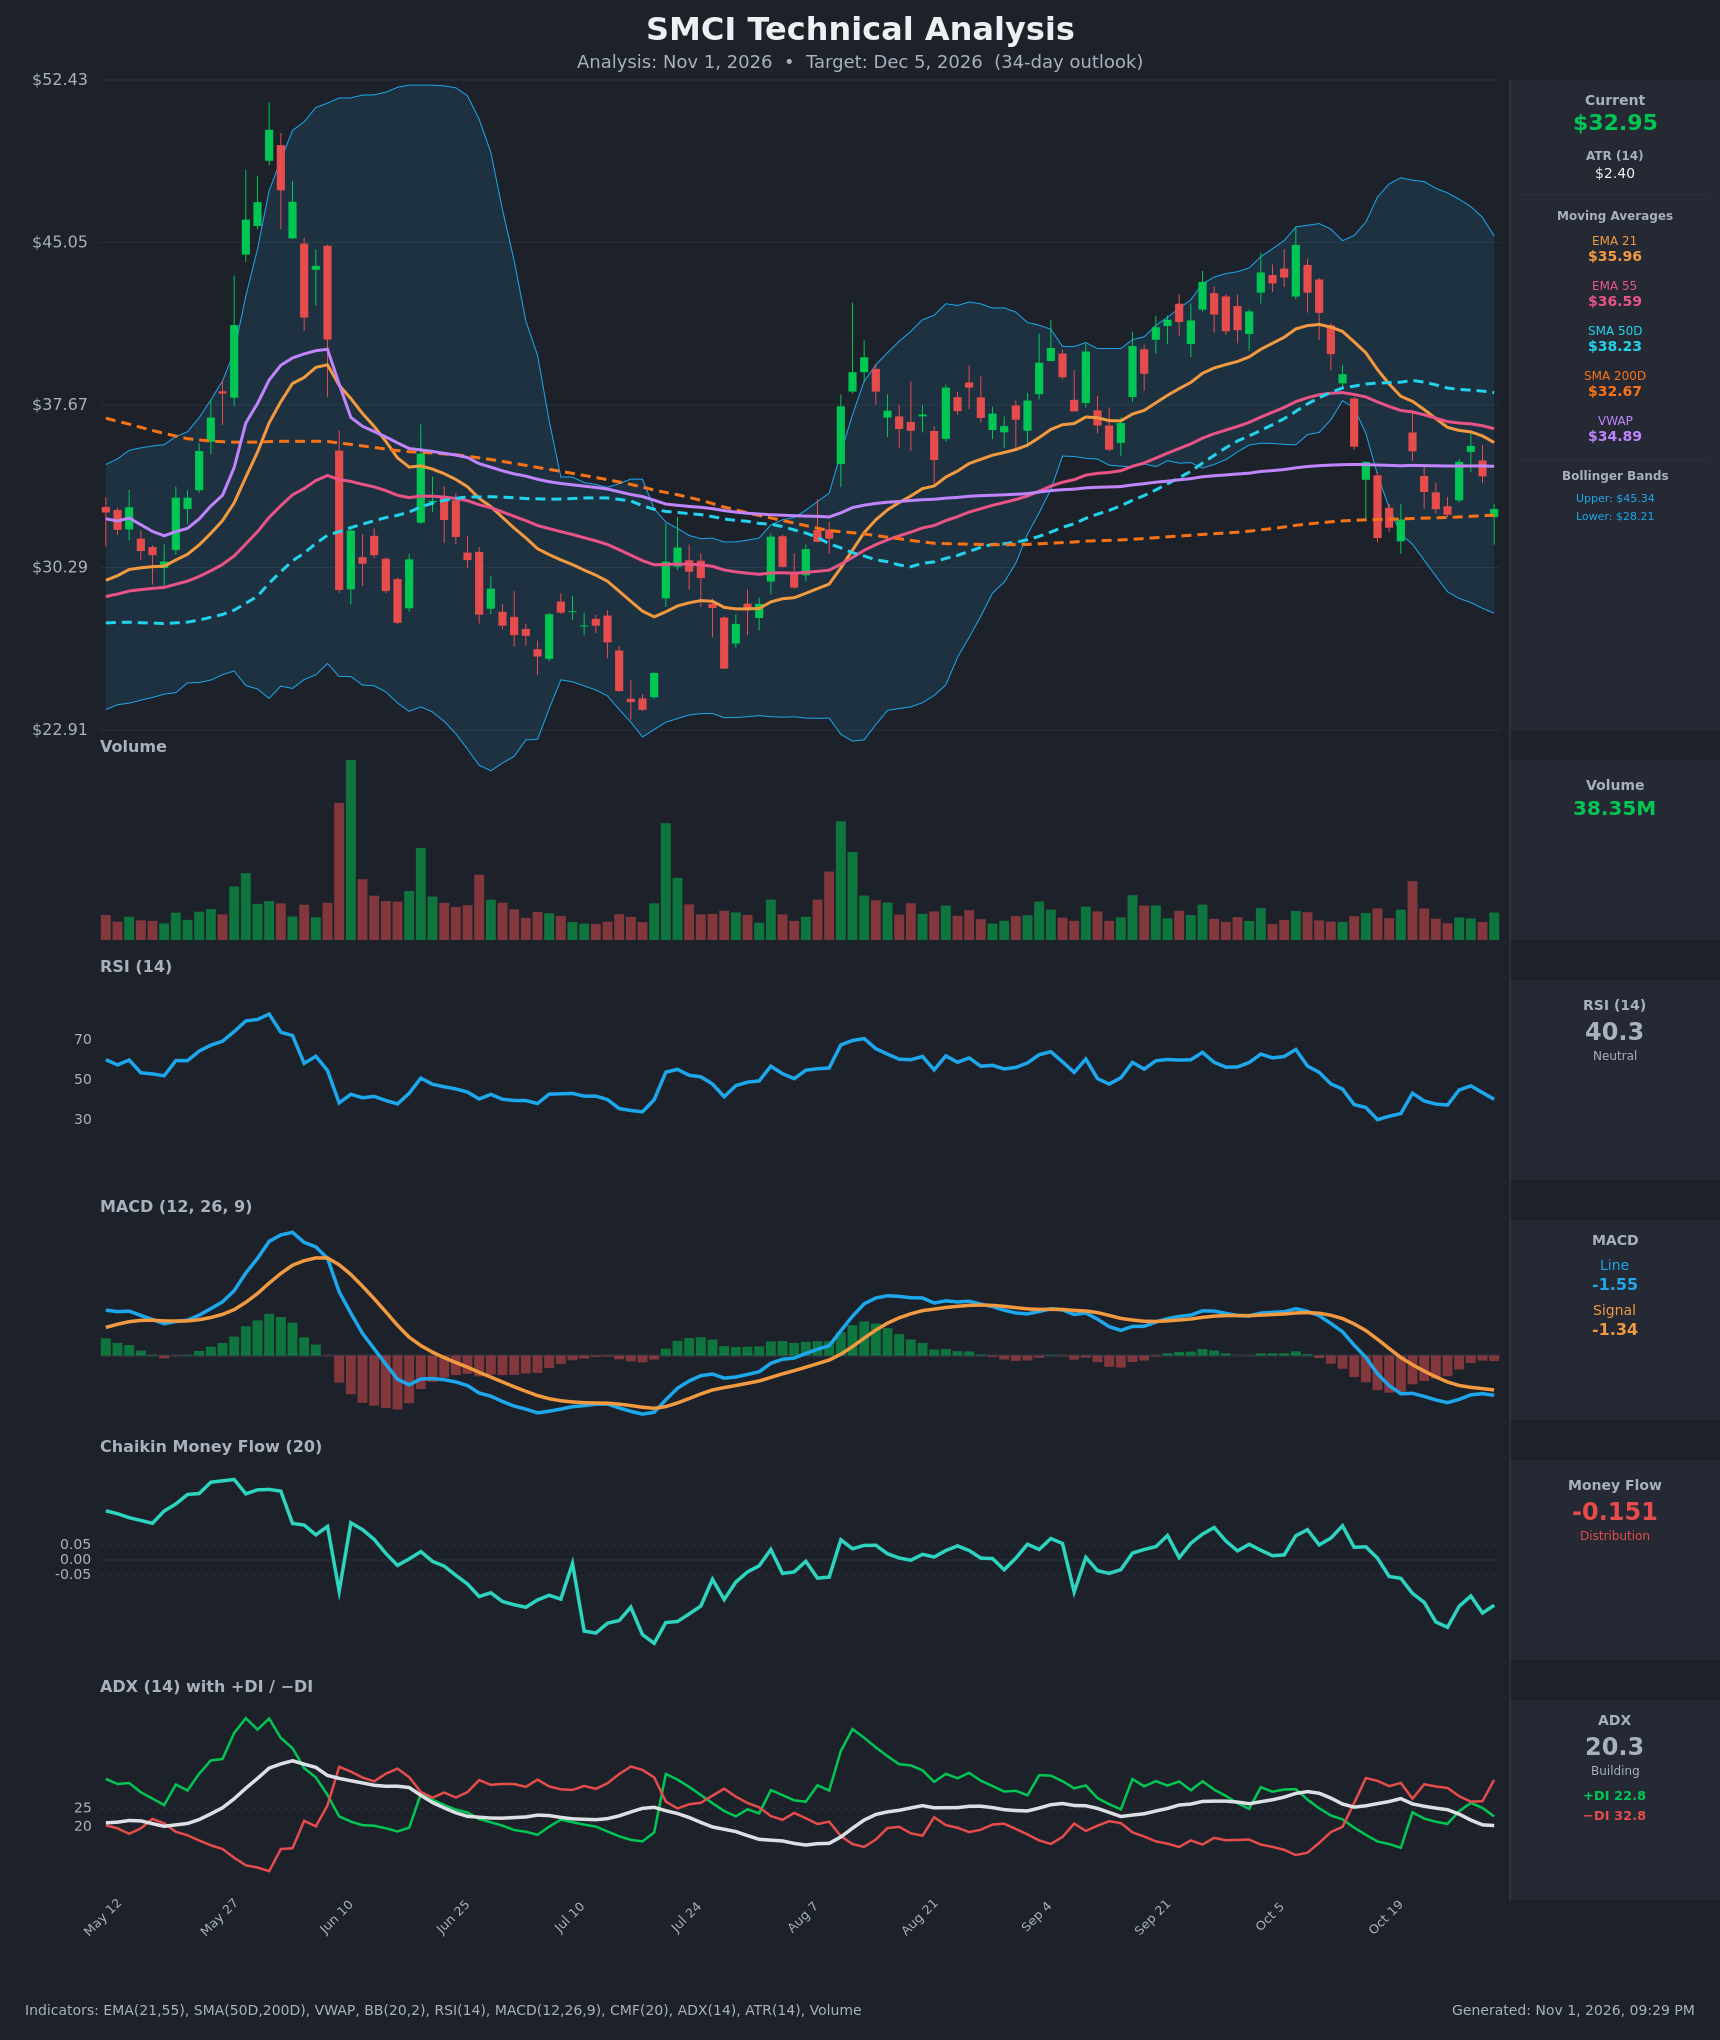
- RSI (14): 40.35, below the 50 midline and recovering from the 30.2 oversold low on Oct 16. The bounce to 47 on Oct 28 failed and RSI has turned back down. Momentum is soft but not oversold. [Bearish]
- 20 EMA: The 21 EMA is $35.96 and price at $32.95 is about 8% below it, so it acts as overhead resistance. The EMA21 has fallen below the EMA55 ($36.59), a bearish cross confirmed around Oct 23. [Bearish]
- MACD: Line -1.55 is below signal -1.34, and both are below zero. The bearish cross happened around Oct 15-20. The gap re-widened over the last two bars after briefly narrowing, so the histogram is negative and not recovering. [Bearish]
- Bollinger Bands (20): Upper $45.34, lower $28.21, mid ~$36.78. Price is in the lower half of the bands, about $4.7 above the lower band. The bands are wide, which reflects high volatility (ATR $2.40, ~7.3% of price), but they are now contracting from the October peak. [Bearish]
- CMF (20): -0.151, well below -0.05, and it has declined steadily from +0.114 on Oct 13. This is persistent distribution. [Distribution]
- ADX (14): 20.3, falling from 27.7, so the trend is weakening. −DI (32.8) is well above +DI (22.8), so bears still control direction. The trend is not strong but leans down. [Weak Trend, Bearish Direction]
- Volume: 38.35M, near average. There were no capitulation spikes in the recent decline, but the heavier bars were on red candles in mid-October. Volume does not confirm a reversal yet. [Neutral-to-Bearish]
DIVERGENCES & TRENDS
- Price vs. RSI: The Oct 16 low ($31.63, RSI 30.2) was followed by a retest at $32.69 (Oct 26, RSI 37.5) and now $32.95 (RSI 40.3). RSI is making higher lows, but this is mild and not a clean bullish divergence.
- MACD: It remains below signal and below zero. A bullish cross would need a sustained close back above ~$36.
- MA structure: The EMA21/EMA55 bearish cross is in place. Price sits below SMA50D ($38.23), VWAP ($34.89), EMA21 and EMA55. The only support is SMA200D ($32.67), which is essentially at price. The SMA50D is rolling over, with a death cross with the SMA200D still possible, though they are 17% apart.
- CMF/ADX: CMF has fallen from positive to -0.15 and −DI dominates. ADX is falling toward 20, so the downtrend is losing steam and a range near the SMA200D is plausible.
- Lower highs: Since the early-October peak (~$45), the closes show a lower-high sequence ($39.98, $35.57, $35.81), which is bearish.
CHART PATTERNS
- Bearish Head and Shoulders / Double Top (partial): The Sept-Oct peak near $44-45 followed by the lower rally to ~$36 is a bearish reversal structure. The break below the ~$35 neckline area (Oct 14-16) supports the pattern. The measured move points toward the $30-31 area and below.
- Support test at SMA200D: Price has bounced twice off $31.6-$32.7 (Oct 16 and Oct 26), a loose double-bottom-like base. A close below ~$31.50 would invalidate it, and the Bollinger lower band ($28.21) is the next target. It would be a Bullish Double Bottom only above ~$36 (the Oct 28 high zone / EMA21).
- Bearish flag/pennant (tentative): The tight consolidation after the October drop between $32-36 resembles a pennant. Resolution below $31.60 would project toward $28.
POTENTIAL SCENARIOS
- Scenario 1: Bearish Breakdown Below SMA200D — Persistent distribution (CMF -0.15), −DI dominance and the bearish EMA/MACD structure push price through the $31.60 double-bottom support. Trigger: a daily close below $31.60 on rising volume. Target: $28.50-$29.50 (lower Bollinger band, near the June-July congestion). Invalidation: a close above $36.00 (EMA21/EMA55). (45% probability)
- Scenario 2: Neutral Range Chop Around the 200-Day — ADX at 20 and falling, with RSI mid-40s, lets price oscillate between $31.60 and $36. Trigger: holds above $31.60 without reclaiming EMA21. Target: $32-35. Invalidation: close outside $31.00-$36.50. (30% probability)
- Scenario 3: Bullish Bounce Off Support — The double-bottom test and the higher RSI lows spark a relief rally to the moving averages. Trigger: a close above $35.80 (the Oct 28 high). Target: $36.60-$38.20 (EMA55, SMA50D). Invalidation: a close below $31.60. (25% probability)
PRICE TARGETS
- Target Price: $31.00 (34 days)
- Expected Range: $26.50 to $37.00 (width $10.50, about 31.9%; wide because ATR is ~7% and the timeframe is 34 days, so this is slightly above the 12-18% guideline, justified by the high-volatility regime)
- Key Levels: Support at $31.60 (the Oct 16 low and SMA200D zone, with $28.21 lower Bollinger band below it), Resistance at $35.96 (EMA21, with EMA55 at $36.59 above)
OVERALL BIAS
OVERALL BIAS: BEARISH - Price is below the EMA21, EMA55, SMA50D and VWAP, with a bearish MACD, −DI dominance and CMF at -0.15 showing distribution. The SMA200D/$31.60 support is the key test, and a loss of it opens the lower Bollinger band near $28.
This is educational analysis and not financial advice.