TSLA 34-day bullish forecast — Nov 1, 2026
- Bias: Bullish
- Timeframe: 34 days (made Nov 1, 2026, target date Dec 4, 2026)
- Price at analysis: $399.81
- Price target: $415.00
- Expected range: $372.00 – $430.00
- Result: Pending — graded after the close on Dec 4, 2026
Get a free AI analysis of TSLA today
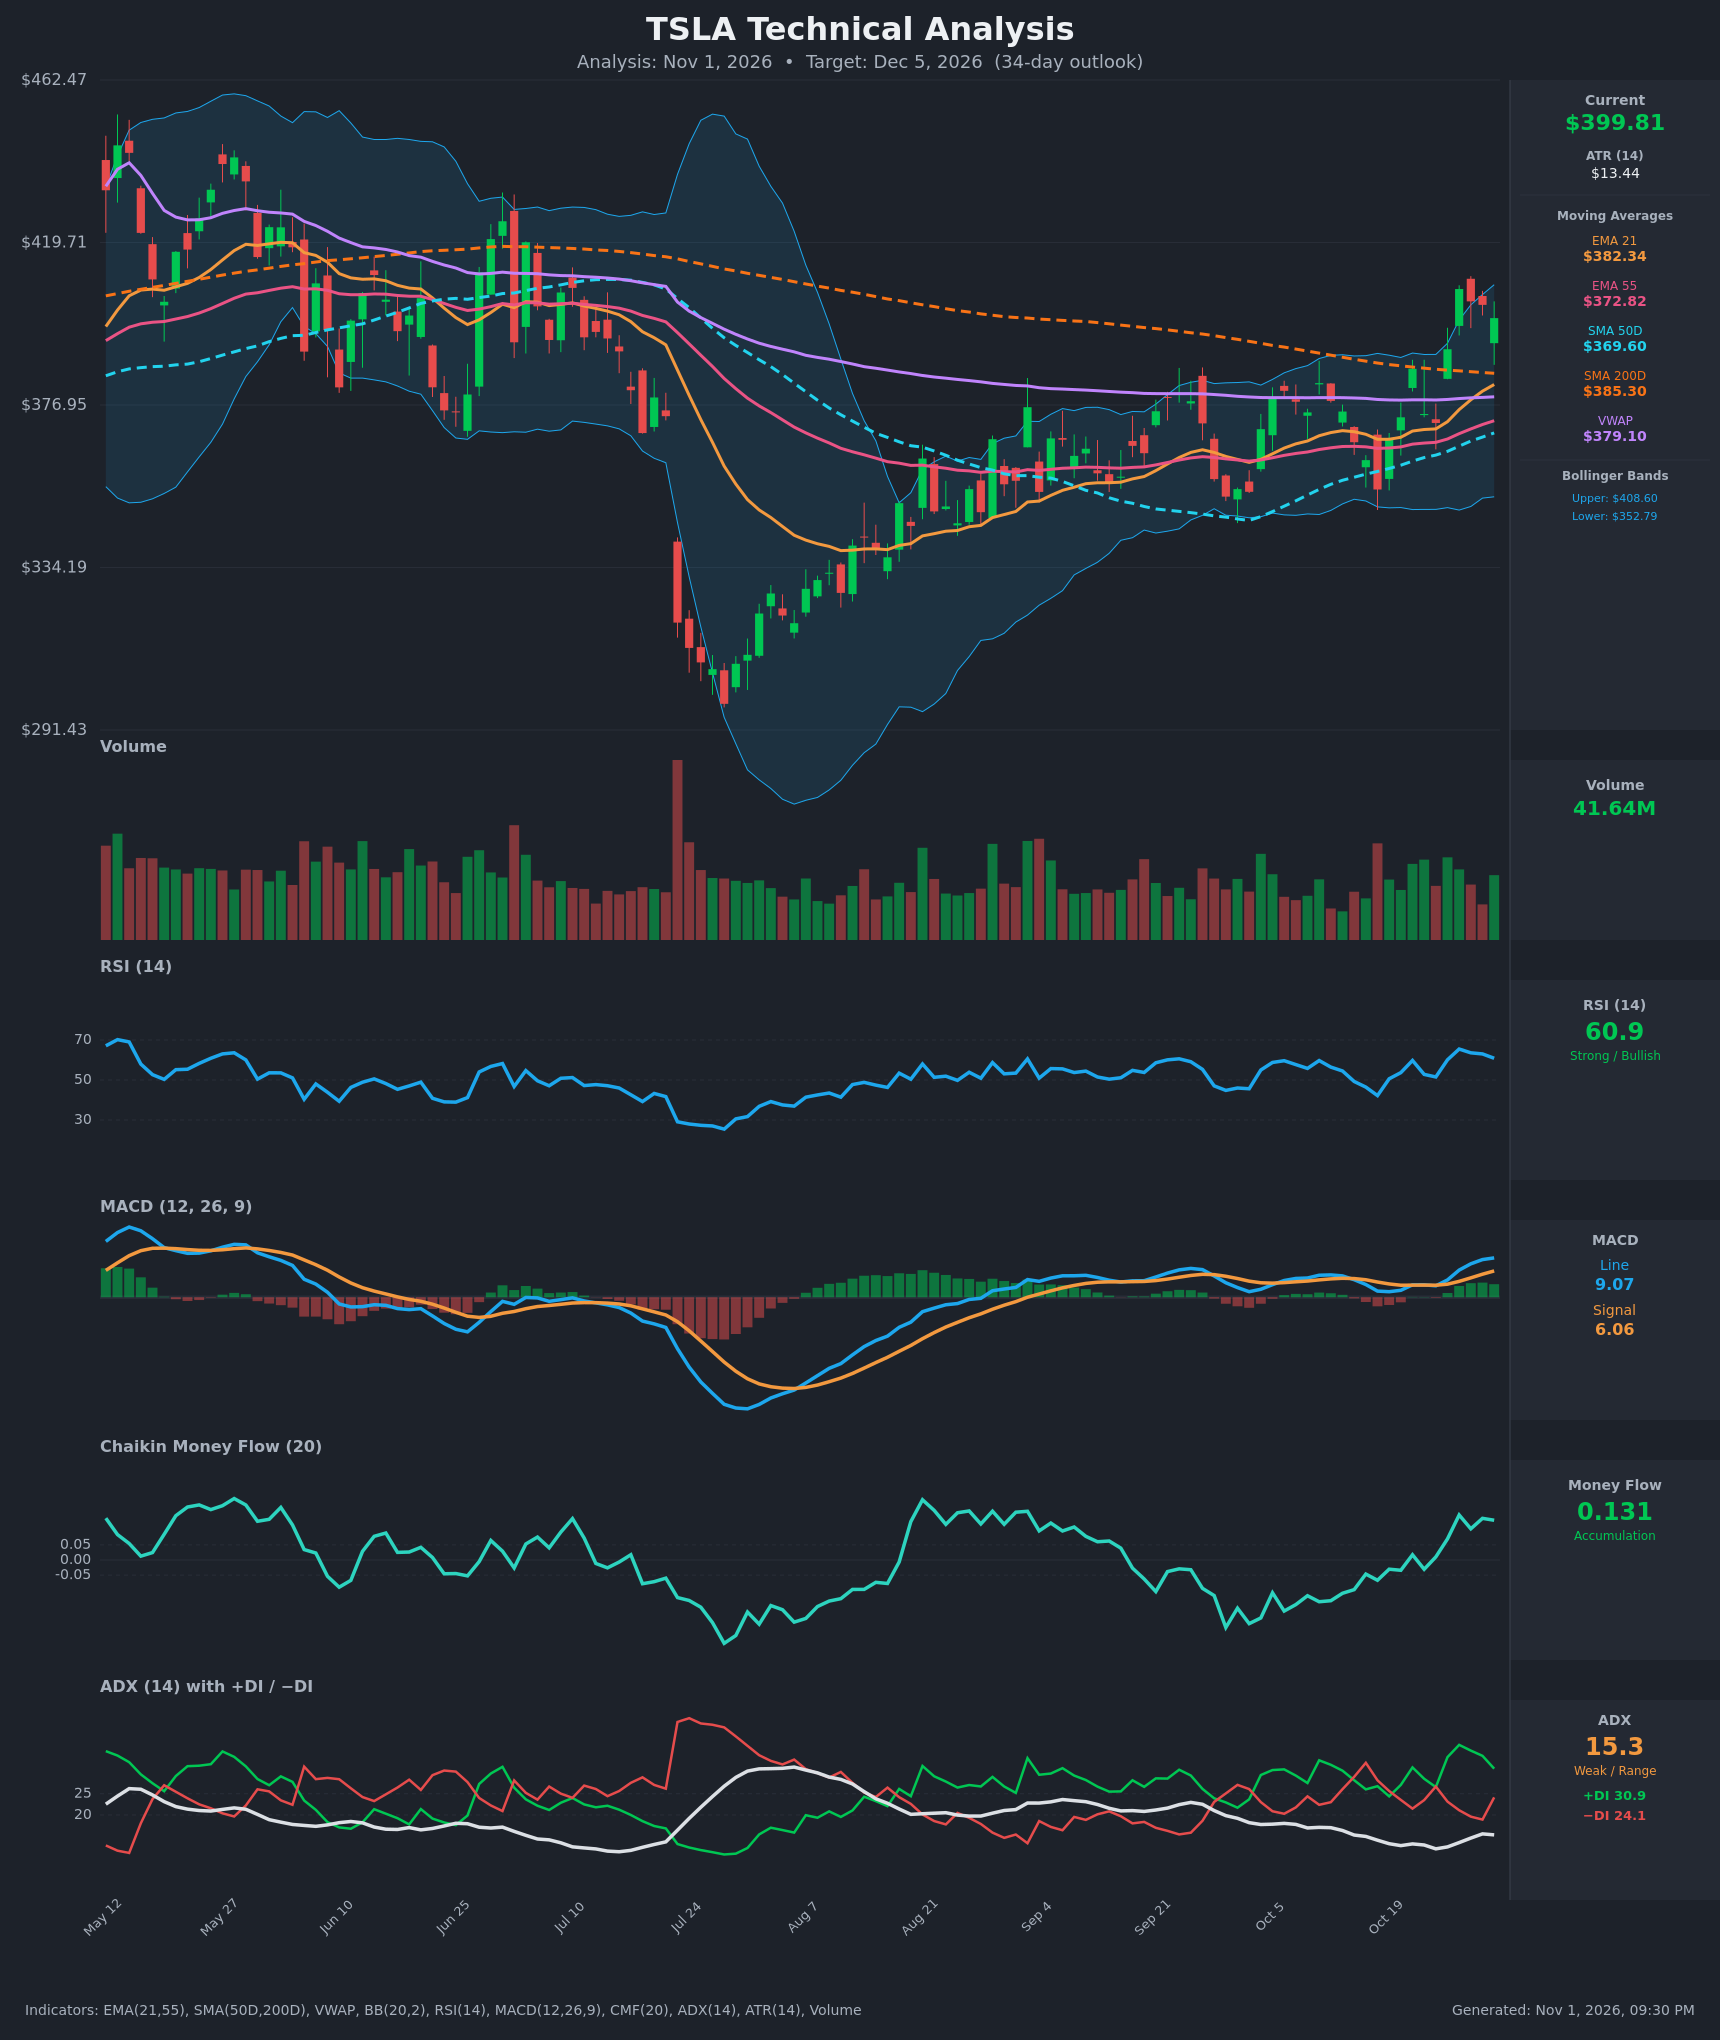
Analysis
TECHNICAL INDICATORS
- RSI (14): 60.86, pulling back from 65.5 on Oct 27 but above 50 and below overbought. Momentum is positive and has room to run. [Bullish]
- 20 EMA (21 EMA on the chart): $382.34, rising and well below the $399.81 price. EMA21 is also above EMA55 ($372.82), so the short-term trend structure is bullish, with the EMA21 as first dynamic support. [Bullish]
- MACD: Line 9.07 is above Signal 6.06, a +3.0 positive spread. The line crossed above the signal around Oct 21 and has kept widening. The histogram is positive and expanding, and the line is at its highest in months. [Bullish]
- Bollinger Bands (20): Upper $408.60, lower $352.79, so price is in the upper third of the bands after tagging the upper band near $407 on Oct 27. The bands have widened after a long squeeze. A band-walk is possible, but the pullback from the upper band shows some short-term exhaustion. [Neutral]
- CMF (20): +0.131, above the +0.05 threshold, and it has risen from -0.135 on Oct 12 to a sustained positive reading since Oct 26. Buyers are stepping in on the breakout. [Accumulation]
- ADX (14): 15.3 with +DI 30.9 above -DI 24.1. Bulls are in control, but trend strength is weak. ADX is below 20, so the move lacks confirmation, and -DI ticked up on the last bar (18.9 to 24.1). [Weak Trend, Bullish lean]
- Volume: 41.64M, moderate and below the heavy-volume spikes seen earlier. The Oct 26-27 breakout candles came on above-average green volume, and the last three pullback days are on lighter volume. This is constructive but not a decisive confirmation. [Mildly Bullish]
Other moving averages:
- SMA50D: $369.60, rising.
- SMA200D: $385.30, now below price for the first time in months and gently declining.
- VWAP: $379.10, below price.
The SMA50D (369.60) is below the SMA200D (385.30). There is no golden cross yet, but the gap has narrowed from about $34 on Oct 12 to about $16.
DIVERGENCES & TRENDS
- There is no meaningful price/indicator divergence. Price made a higher high at $407 on Oct 27, and MACD kept climbing to a new high (9.07). RSI peaked at 65.5 and has eased with price, which is normal behavior, not divergence.
- Trending behavior:
- MACD has been rising for 8 sessions.
- CMF has swung from distribution to accumulation.
- +DI has been above -DI on most recent bars.
- Breaks and crossovers:
- Price has recently reclaimed the EMA21, EMA55, SMA50D, VWAP and SMA200D, a clean multi-average break.
- MACD crossed bullishly around Oct 21.
- EMA21 is above EMA55.
- The SMA50D/SMA200D golden cross has not yet occurred.
- The weak ADX (15.3) means the price is breaking out of a low-trend-strength environment, so failed breakouts are a real risk.
- Price has pulled back three bars from the $407 high, and a retest of the SMA200D or EMA21 zone would be a healthy test.
CHART PATTERNS
- Base/rectangle breakout (resembles Bullish Triple Top/Rectangle and Ascending Triangle from the reference): From August to October price chopped between about $350 and $385 with higher lows. The late-October surge broke above the range top and the SMA200D.
- Measured move: the range height of about $35 added to the $385 breakout level gives roughly $420.
- This is also near the $419.71 horizontal level on the chart, which is prior resistance from May-June.
- Recovery from the July low (~$300): A V-shaped or rounded recovery over four months. It is not a textbook pattern, but the sequence of higher lows supports a bullish structure.
- Bearish caveat: the $407-$410 area is a minor double-top candidate (the Oct 27 high and the Oct 29-30 retests). A close below $385 would turn this into a failed breakout, with downside to the $369-$372 cluster.
POTENTIAL SCENARIOS
- Scenario 1: Bullish Breakout Continuation — Price holds above the SMA200D and EMA21, then pushes through the $407-$409 upper-band/high zone and targets the base measured move and the old $420 resistance. Trigger: daily close above $409 on rising volume with MACD staying above signal. Target: $418-$425. Invalidation: daily close below $382 (EMA21/SMA200D zone). (50% probability)
- Scenario 2: Neutral Range Consolidation — Price digests the breakout between the SMA200D and recent highs while ADX stays weak. Trigger: failure to close above $409 with price oscillating around $385-$408. Target: $392-$405. Invalidation: close above $412 or below $380. (20% probability)
- Scenario 3: Bearish Failed Breakout — The weak ADX and a lower-high near $407 lead to a failed breakout and a return into the old range. Trigger: close below $382 with CMF dropping below 0. Target: $365-$372 (SMA50D/EMA55 zone). Invalidation: reclaim of $410. (30% probability)
PRICE TARGETS
- Target Price: $415.00 (34-day horizon, Dec 5, 2026)
- Expected Range: $372.00 to $430.00 (width $58 ≈ 14.5% of the current price, in line with the 12-18% guidance for 30-60 days)
- Key Levels: Support at $385.30 (SMA200D, with EMA21 at $382.34 just below), Resistance at $408.60 (upper Bollinger Band / recent high zone, then $419.71)
OVERALL BIAS
OVERALL BIAS: BULLISH - Price has broken above all key moving averages including the SMA200D. MACD is rising above its signal, CMF shows accumulation, and +DI leads -DI, with a measured move toward about $420. The weak ADX (15.3) and the upper-band test cap conviction, so a retest of $382-$385 is likely along the way.
This is educational analysis and not financial advice.