TQQQ 34-day bearish forecast — Nov 1, 2026
- Bias: Bearish
- Timeframe: 34 days (made Nov 1, 2026, target date Dec 4, 2026)
- Price at analysis: $62.01
- Price target: $59.00
- Expected range: $54.50 – $65.00
- Result: Pending — graded after the close on Dec 4, 2026
Get a free AI analysis of TQQQ today
Analysis
TECHNICAL INDICATORS
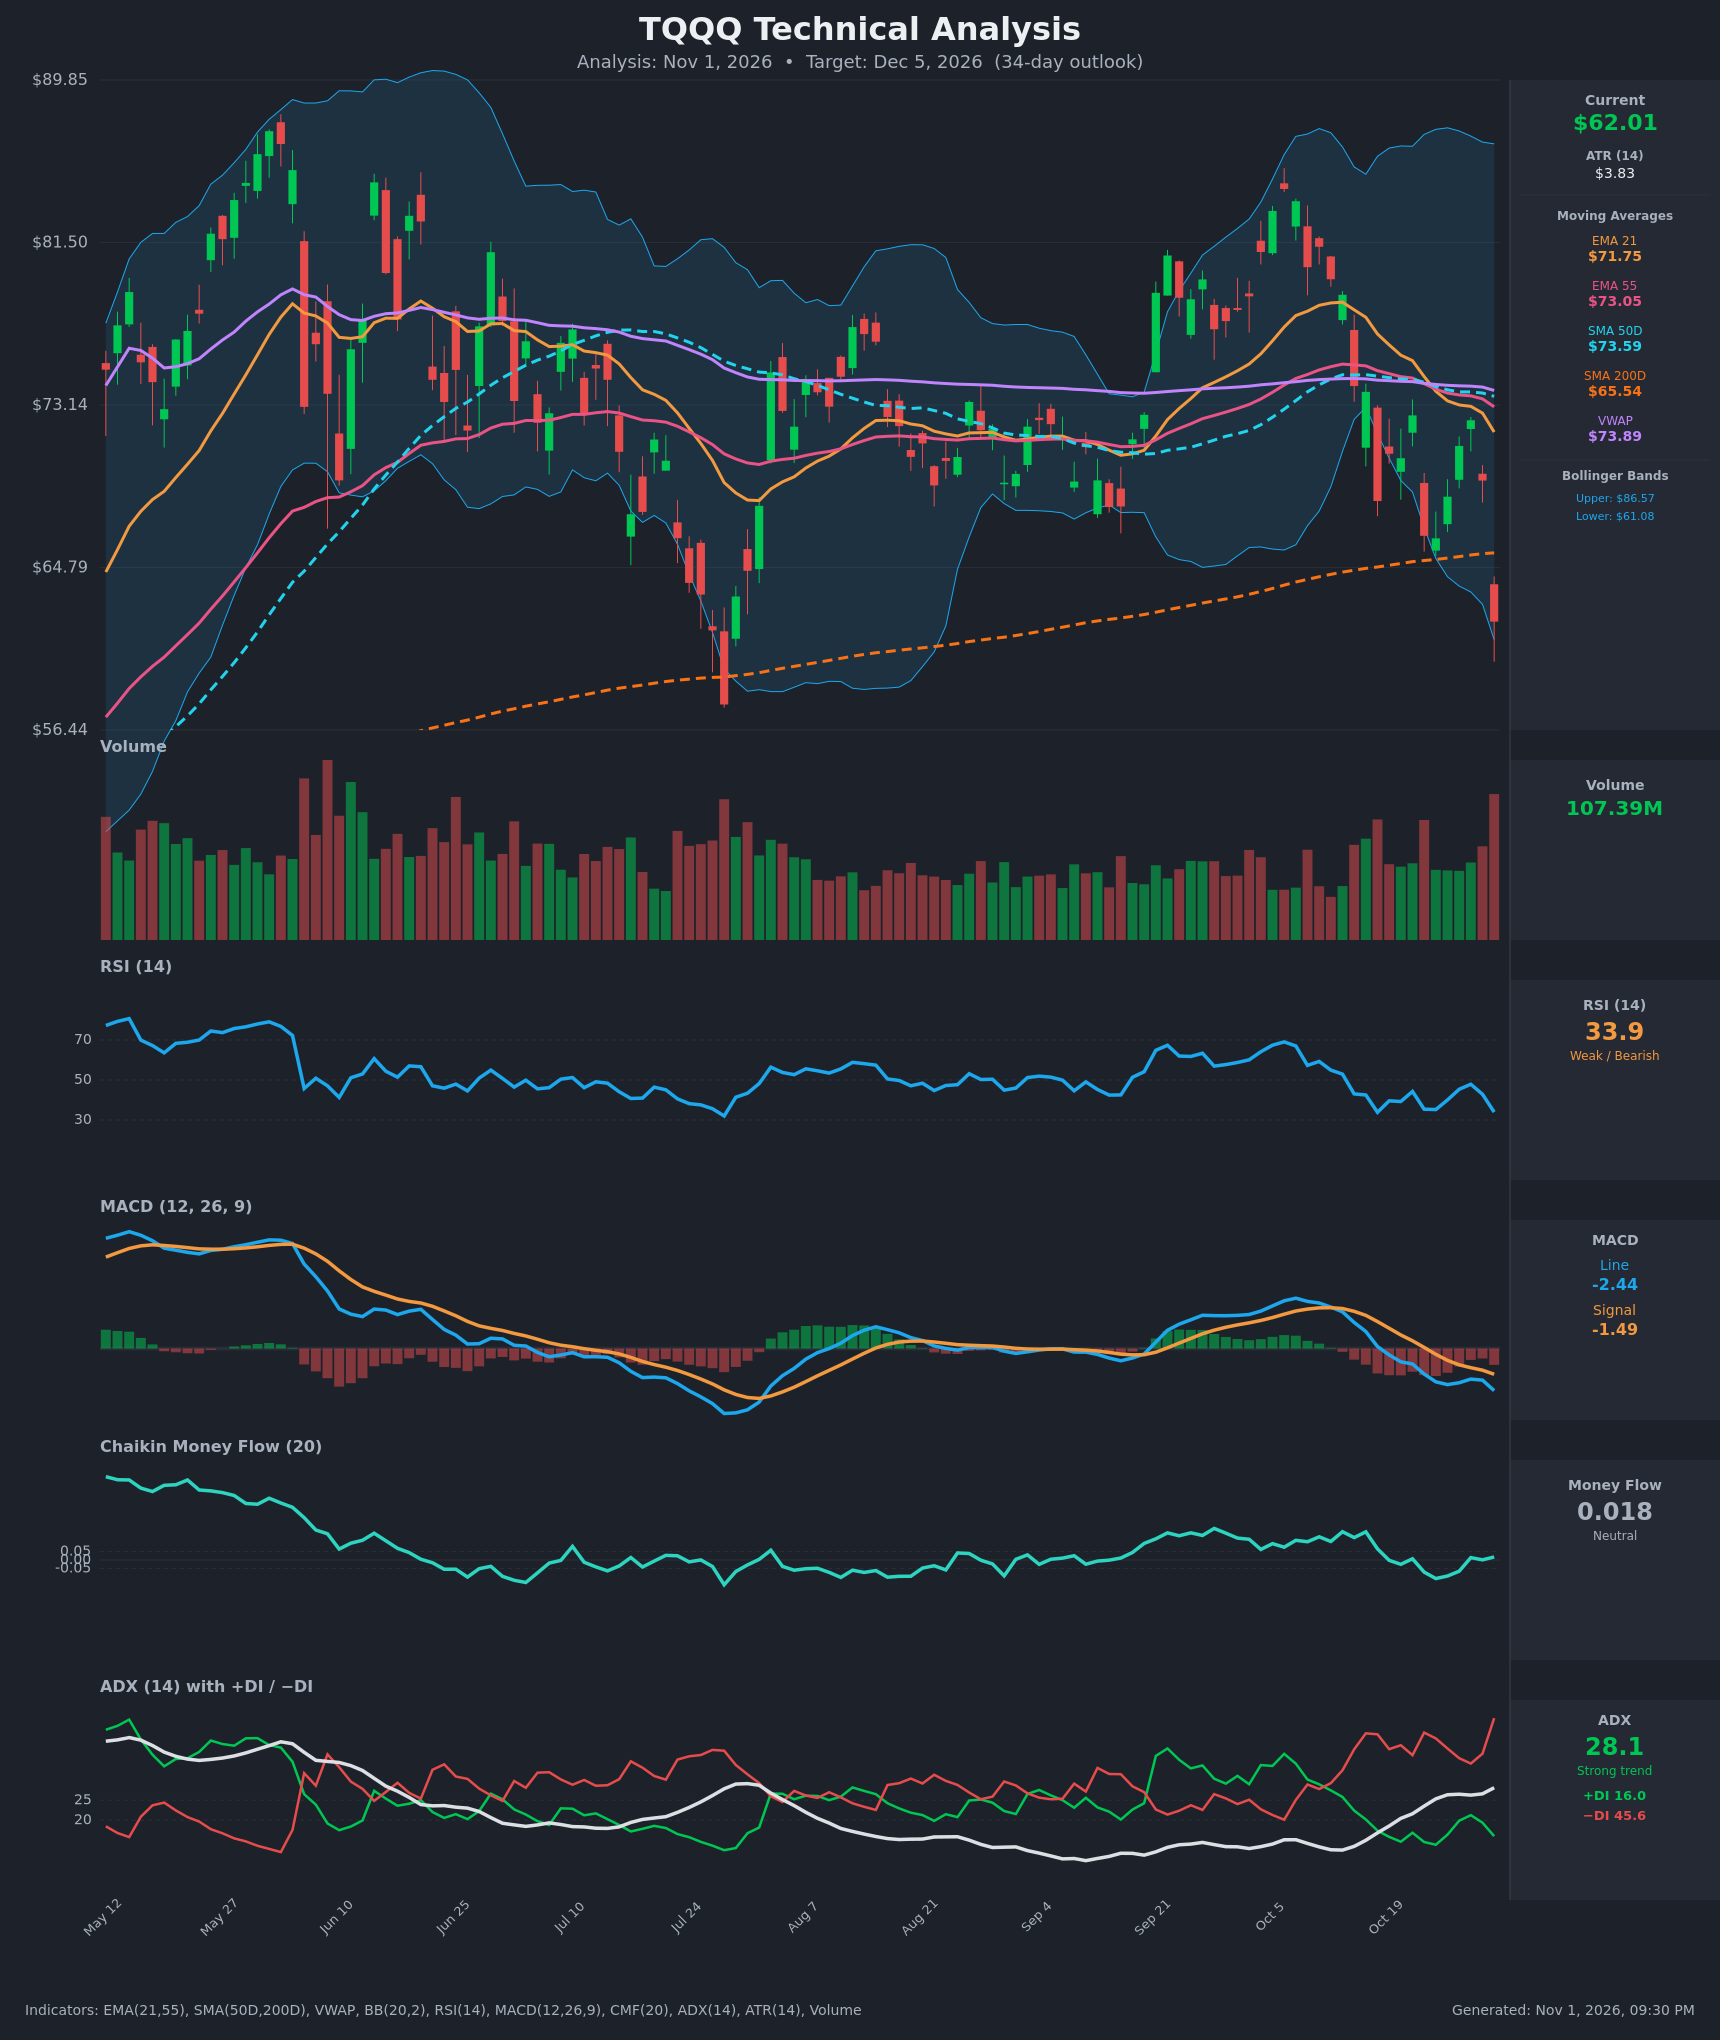
- RSI (14): 33.95, down from 47.9 on Oct 28 and approaching the 30 oversold line. It has made lower highs through October (about 54.9, then 44.3, then 47.9). Momentum is weak but not yet an extreme washout. [Bearish]
- 20 EMA: The 21 EMA is $71.75, and price at $62.01 is about 13.6% below it, so it acts as overhead resistance. The EMA21 crossed below the EMA55 ($73.05) around Oct 23, a bearish crossover. [Bearish]
- MACD: The line is -2.435 and the signal is -1.490, so the line is below the signal. It crossed below zero on Oct 19, and the histogram is increasingly negative and still widening. [Bearish]
- Bollinger Bands (20): The bands run from $61.08 (lower) to $86.57 (upper), and price sits just above the lower band after a roughly 10% one-day drop. The wide bands show elevated volatility. This is stretched and could bounce, but riding the lower band signals a strong downtrend. [Bearish]
- CMF (20): 0.018, inside the ±0.05 neutral zone. It has drifted down from about +0.17 in mid-October and has not turned into clear distribution. [Neutral]
- ADX (14): 28.1 and rising (from 12.5 on Oct 13), which marks a strong trend. −DI at 45.6 is far above +DI at 16.0, so sellers are firmly in control. [Strong Trend – Bearish]
- Volume: 107.39M, the largest bar on the chart, on a heavy red candle. That is a decisive, high-conviction breakdown below the SMA200. It could also mark capitulation, but it confirms selling pressure for now. [Bearish / possible capitulation]
Other moving averages and VWAP:
- Price is below the SMA50D ($73.59), VWAP ($73.89) and SMA200D ($65.54).
- The close below the SMA200 is a significant long-term breakdown.
- The SMA50D remains above the SMA200D, so there is no death cross yet.
DIVERGENCES & TRENDS
- There is no bullish RSI divergence yet. RSI is making lower highs and is not yet at a lower low relative to the Oct 16 and Oct 22 readings (33.8 and 35.4). The current 33.9 is roughly equal, so it is a possible early double-bottom in RSI but unconfirmed.
- Price made a lower high near $84–85 in early October compared with the $88–90 peak in May–June. The MACD peak was also lower, which fits a bearish trend of lower highs.
- ADX is turning up from the lows with −DI dominant, so the bearish trend is gaining strength.
- Crossovers: the EMA21 fell below the EMA55 (bearish), MACD is below its signal and the zero line, and price lost the SMA200.
- The 21 EMA, 55 EMA, SMA50 and VWAP are clustered near $72–74, which forms a thick supply zone above price.
CHART PATTERNS
- The broad structure resembles a Bearish Double Top (peaks near $88–90 in June and about $84–85 in early October), with a breakdown through the mid-range and the SMA200. The July low near $58 is the key "neckline" area. A confirmed break below it would be a larger bearish signal, though the full measured move is well beyond a 34-day horizon.
- Recent price action also looks like a failed range between about $66 and $84 that has broken to the downside. This is a loose resemblance to the diagram rather than a textbook match.
- The price is extended below the lower Bollinger Band zone, so a short-term relief bounce toward the SMA200 (about $65.5) is plausible without changing the bearish structure.
POTENTIAL SCENARIOS
- Scenario 1: Bearish Trend Continuation — Price stays below the SMA200 and EMAs, with −DI dominant and ADX rising. Rallies fail at the $65.5–68 zone and price tests the July low area. Trigger: daily close below $60 and a failed retest of the SMA200. Target: $57–59, with an extension toward $54–55. Invalidation: daily close above $68 on rising volume. (50% probability)
- Scenario 2: Bullish Oversold Bounce / Mean Reversion — A capitulation-volume flush with RSI near 30 and price at the lower band triggers a rebound toward the SMA200 and the EMA cluster. Trigger: reclaim of $65.5 (SMA200) with MACD histogram ticking up. Target: $68–72 (EMA21 at $71.75). Invalidation: close below $58. (35% probability)
- Scenario 3: Neutral Choppy Base — Price ranges between about $58 and $66 as volatility compresses and a base forms. Trigger: ADX rolls over below 25 and RSI holds above 30. Target: $60–64. Invalidation: a close beyond either edge of the range. (15% probability)
PRICE TARGETS
For the 34-day timeframe, the Expected Range width is $10.50, about 16.9% of the current price, which fits the 12–18% guidance for 30–60 days.
- Target Price: $59.00 (34 days)
- Expected Range: $54.50 to $65.00
- Key Levels: Support at $58.00, Resistance at $65.54
OVERALL BIAS
OVERALL BIAS: BEARISH - Price has broken below the SMA200 on the heaviest volume of the chart, with −DI far above +DI, ADX rising above 25, a bearish MACD and a bearish EMA cross. Oversold RSI raises the odds of a relief bounce, but rallies into the $65.5–74 resistance cluster are likelier to be sold.
This is educational analysis and not financial advice.