XLE 34-day bullish forecast — Nov 1, 2026
- Bias: Bullish
- Timeframe: 34 days (made Nov 1, 2026, target date Dec 4, 2026)
- Price at analysis: $70.02
- Price target: $72.00
- Expected range: $64.50 – $75.00
- Result: Pending — graded after the close on Dec 4, 2026
Get a free AI analysis of XLE today
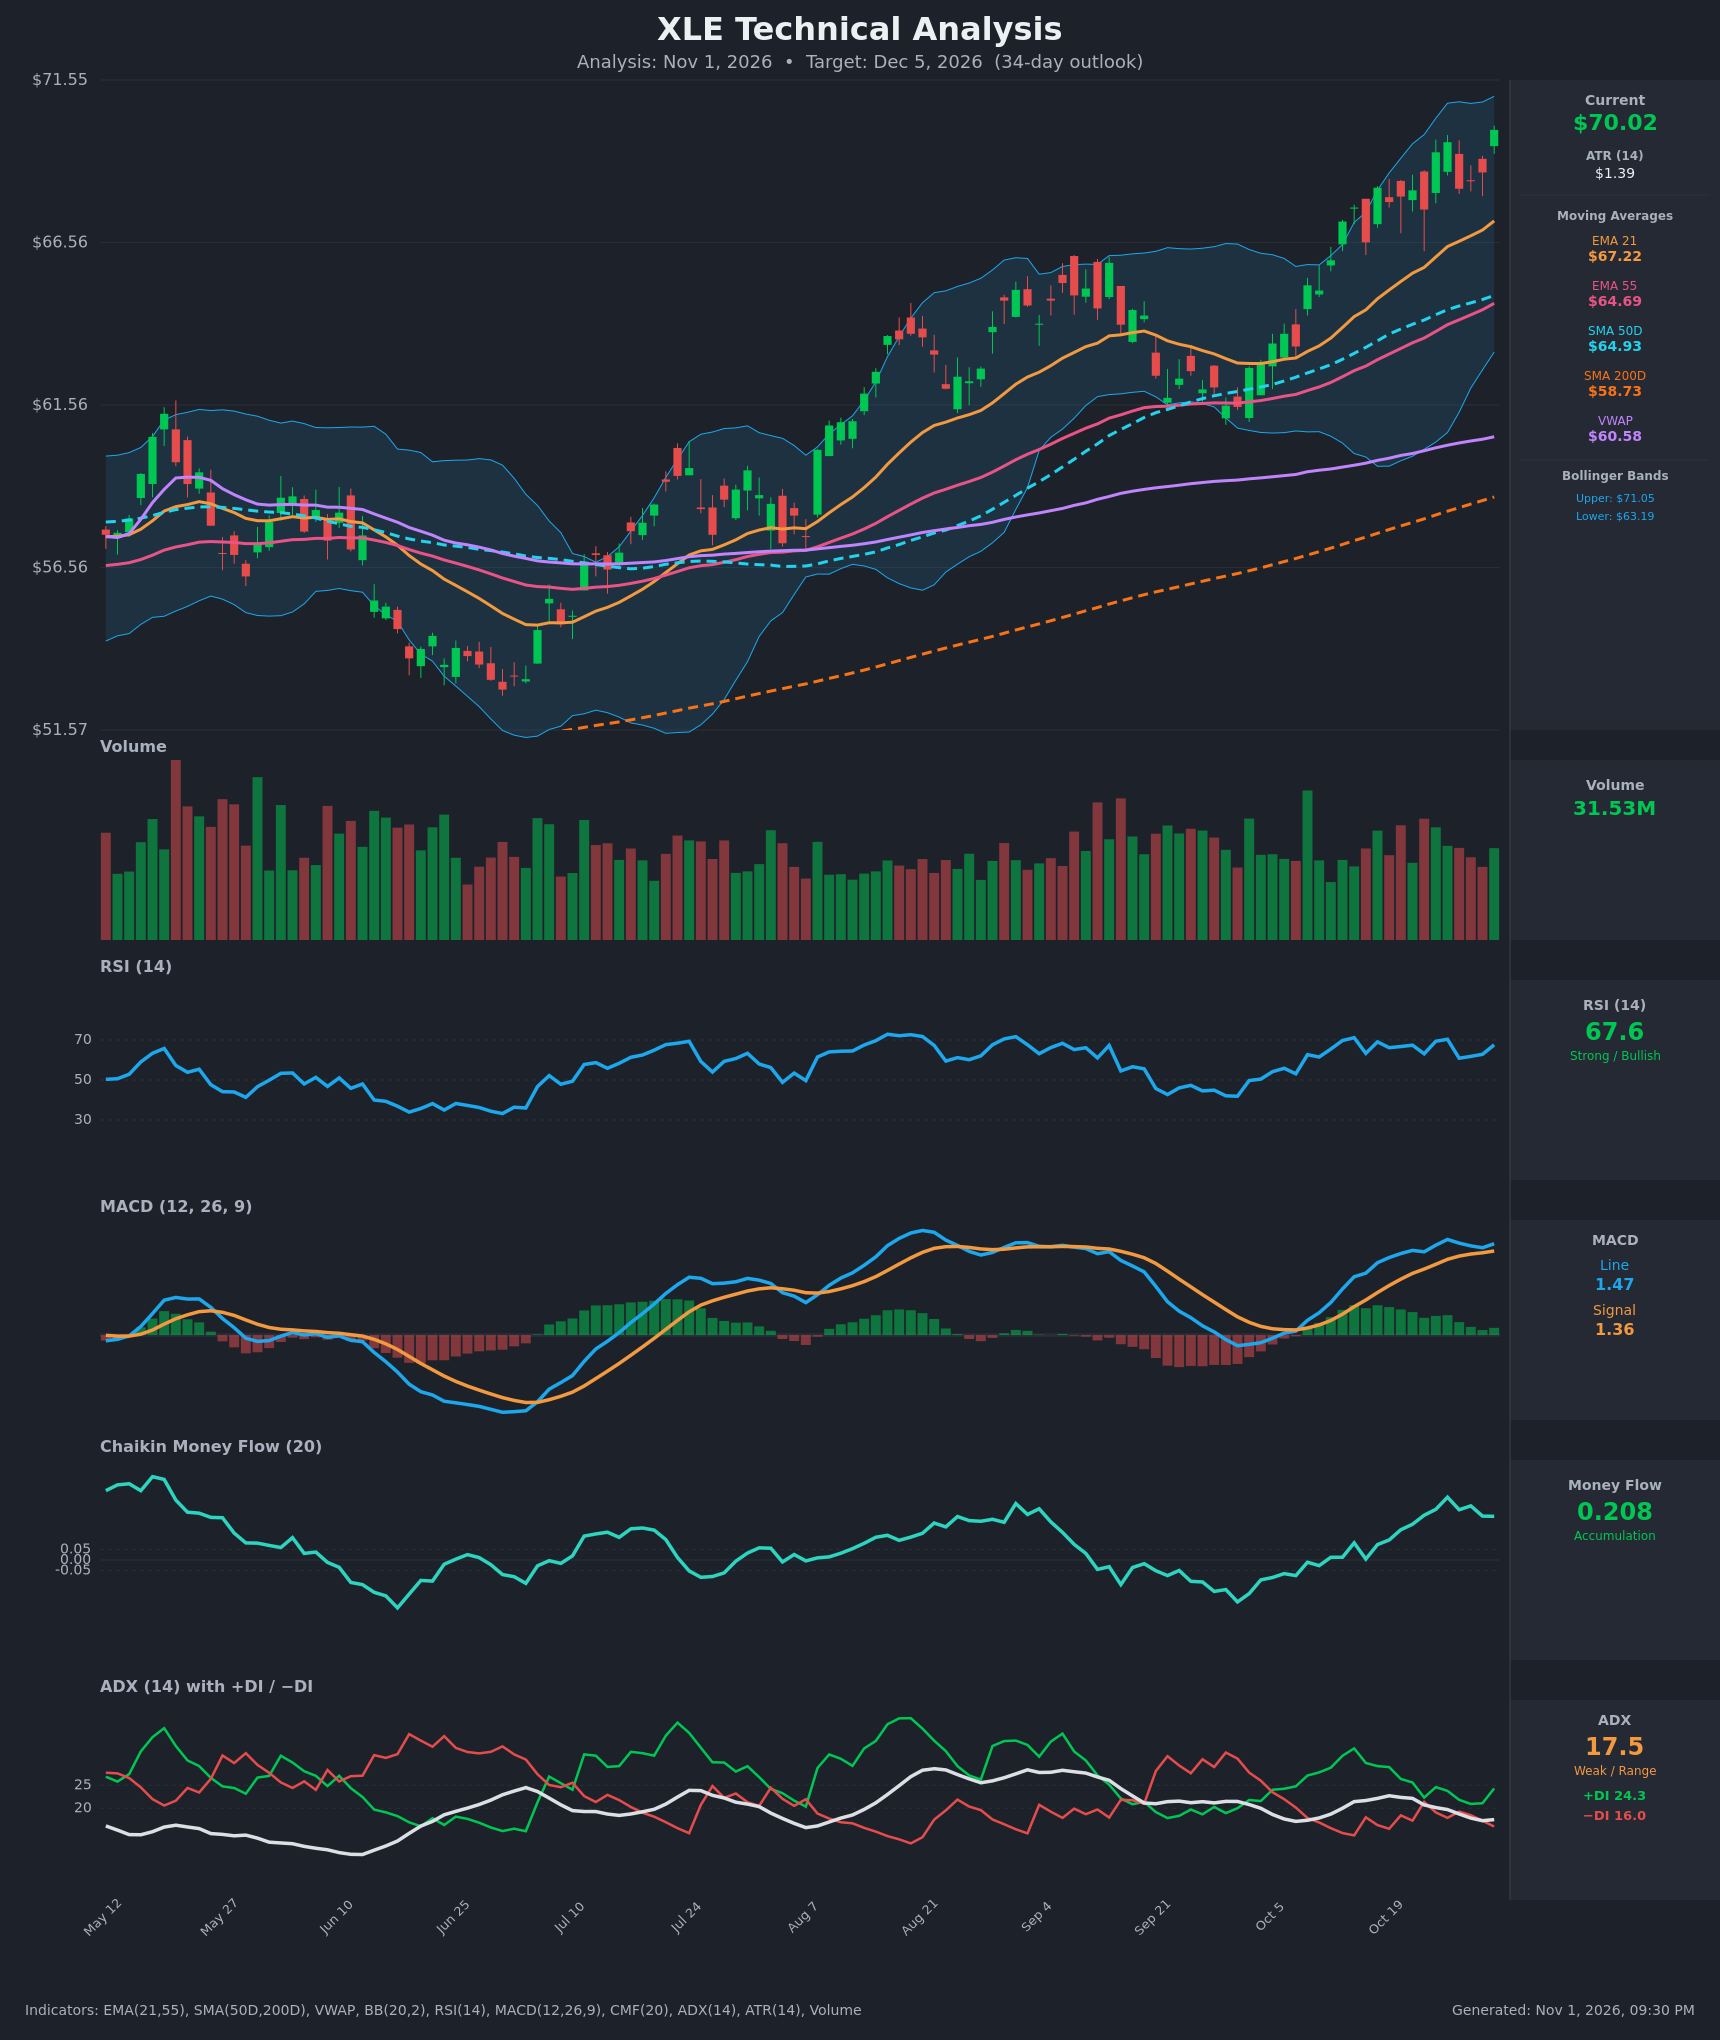
Analysis
TECHNICAL INDICATORS
- RSI (14): 67.58, just below the 70 overbought line. It has held in a 61-71 band for several weeks and is bouncing off 61-63 dips, so momentum is strong but close to stretched. [Bullish]
- 20 EMA (EMA 21 = $67.22): Price at $70.02 is about 4.2% above the EMA 21, which is rising and acting as dynamic support. EMA 21 is above EMA 55 ($64.69), so the short-term trend is up, though price is extended from the mean. [Bullish]
- MACD: The line (1.473) is above the signal (1.357) with a small positive histogram of about +0.12. The histogram faded from Oct 26 to Oct 29 and ticked back up on Oct 30. Momentum is positive but flattening. [Bullish]
- Bollinger Bands (20): Price is near the upper band ($71.05), with the lower band at $63.19. The bands are wide and expanding upward, so this is a "walking the band" trend move. Overextension raises the odds of a pause or pullback toward the midline (about $67.1). [Neutral]
- CMF (20): 0.208, well above +0.05 and trending higher since late September (peaking near 0.30 on Oct 26). Volume-backed buying pressure is confirming the rally. [Accumulation]
- ADX (14): 17.5 and falling from 22.7, which is weak and below 20. +DI (24.3) is above −DI (16.0), so bulls control direction, but trend strength is lacking, which points to a grinding advance rather than an accelerating one. [Weak Trend, Bullish direction]
- Volume: 31.53M, about average with no climactic spike. The large green bars on the early-October breakout show participation, and recent pullback days have not drawn heavy selling. [Neutral-to-Bullish]
DIVERGENCES & TRENDS
- Bullish structure: SMA50D ($64.93) is well above SMA200D ($58.73), so the golden cross is in place. Price is above every moving average and VWAP ($60.58), all of which are rising.
- Mild momentum divergence: Price made a new high at $70.02 while RSI (67.6) is below its Oct 26 reading (70.3) and the MACD histogram is smaller than in mid-October. This is a mild warning, not a confirmed bearish divergence.
- ADX fading: ADX dropped from about 22.7 to 17.5 while price kept rising, so the trend is advancing without strength. +DI dipped to roughly equal −DI on Oct 22 and has since recovered.
- No crossovers: MACD has stayed above its signal line since the early-October bullish cross, and EMA 21 has stayed above EMA 55.
- CMF: It is rising and sustained positive, which supports the price advance.
CHART PATTERNS
- Breakout from a consolidation (Ascending Triangle-style continuation): Price ranged under resistance at about $66.5 from late August to September, then broke above it in October. The measured move from the roughly $4-5 base height points to about $71-72, which is near the current price and the upper Bollinger Band.
- Rising channel: The October advance is steep and orderly. The tight closes near $68-70 resemble a small bullish flag or pennant, but it has not broken out yet. A close above about $70.5 would confirm continuation toward $72-73.
- Risk: The advance from the $61 base could be read as a Bearish Rising Wedge if momentum keeps fading. This is not confirmed, and a close below $67 would be the trigger.
POTENTIAL SCENARIOS
- Scenario 1: Bullish Trend Continuation — Price breaks the upper Bollinger Band and the $71.55 high, supported by strong accumulation (CMF 0.21) and a rising EMA 21. Trigger: daily close above $71.55 with MACD histogram expanding. Target: $72.00-$74.00. Invalidation: close below $67.20 (EMA 21). (50% probability)
- Scenario 2: Bearish Pullback to the Mean — Overbought conditions, weak ADX and a mild RSI/MACD momentum fade produce a retracement to the EMA 21 and Bollinger midline. Trigger: rejection at $71 and a close below $68.50. Target: $66.50-$67.20, and possibly $64.90 (SMA50D) on a deeper drop. Invalidation: close back above $70.50. (30% probability)
- Scenario 3: Neutral Consolidation — Price chops between EMA 21 and the upper band while ADX stays below 20. Trigger: failure to close above $71.55 or below $67.20. Target: $67.50-$71.00. Invalidation: a daily close outside that range. (20% probability)
PRICE TARGETS
- Target Price: $72.00 (34-day horizon)
- Expected Range: $64.50 to $75.00 (width $10.50, about 15% of the current price, consistent with the 30-60 day guidance of 12-18%)
- Key Levels: Support at $67.22 (EMA 21), Resistance at $71.55 (recent high and upper chart boundary)
OVERALL BIAS
OVERALL BIAS: BULLISH - Price is above all rising moving averages with an intact golden cross, a positive MACD, +DI above −DI, and strong CMF accumulation (0.21). The weak ADX and the extended position at the upper Bollinger Band limit conviction and make a pullback toward $67 plausible along the way.
This is educational analysis and not financial advice.